
Page 176 - Fundamentals of Gas Shale Reservoirs
P. 176
156 PORE PRESSuRE PREdIcTIOn FOR ShAlE FORmATIOnS uSInG WEll lOG dATA
Well#6 Well#6 Well#6
3
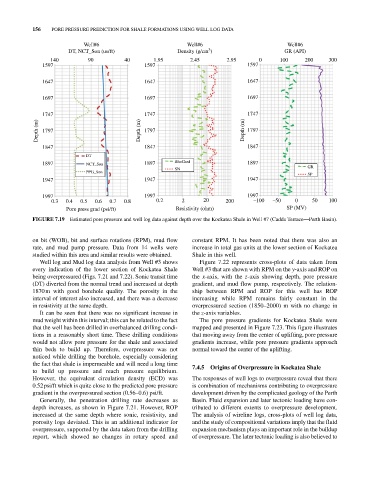
DT, NCT_Son (us/ft) Density (g/cm ) GR (API)
140 90 40 1.95 2.45 2.95 0 100 200 300
1597 1597 1597
1647 1647 1647
1697 1697 1697
1747 1747 1747
Depth (m) 1797 Depth (m) 1797 Depth (m) 1797
1847 1847 1847
DT
1897 NCT_Son 1897 RhoGard 1897
SN GR
PPG_Son SP
1947 1947 1947
1997 1997 1997
0.3 0.4 0.5 0.6 0.7 0.8 0.2 2 20 200 –100 –50 0 50 100
Pore press grad (psi/ft) Resistivity (ohm) SP (MV)
FIGURE 7.19 Estimated pore pressure and well log data against depth over the Kockatea Shale in Well #7 (cadda Terrace—Perth Basin).
on bit (WOB), bit and surface rotations (RPm), mud flow constant RPm. It has been noted that there was also an
rate, and mud pump pressure. data from 14 wells were increase in total gas units at the lower section of Kockatea
studied within this area and similar results were obtained. Shale in this well.
Well log and mud log data analysis from Well #3 shows Figure 7.22 represents cross‐plots of data taken from
every indication of the lower section of Kockatea Shale Well #3 that are shown with RPm on the y‐axis and ROP on
being overpressured (Figs. 7.21 and 7.22). Sonic transit time the x‐axis, with the z‐axis showing depth, pore pressure
(dT) diverted from the normal trend and increased at depth gradient, and mud flow pump, respectively. The relation-
1870 m with good borehole quality. The porosity in the ship between RPm and ROP for this well has ROP
interval of interest also increased, and there was a decrease increasing while RPm remains fairly constant in the
in resistivity at the same depth. overpressured section (1850–2000) m with no change in
It can be seen that there was no significant increase in the z‐axis variables.
mud weight within this interval; this can be related to the fact The pore pressure gradients for Kockatea Shale were
that the well has been drilled in overbalanced drilling condi- mapped and presented in Figure 7.23. This figure illustrates
tions in a reasonably short time. These drilling conditions that moving away from the center of uplifting, pore pressure
would not allow pore pressure for the shale and associated gradients increase, while pore pressure gradients approach
thin beds to build up. Therefore, overpressure was not normal toward the center of the uplifting.
noticed while drilling the borehole, especially considering
the fact that shale is impermeable and will need a long time 7.4.5 Origins of Overpressure in Kockatea Shale
to build up pressure and reach pressure equilibrium.
however, the equivalent circulation density (Ecd) was The responses of well logs to overpressure reveal that there
0.52 psi/ft which is quite close to the predicted pore pressure is combination of mechanisms contributing to overpressure
gradient in the overpressured section (0.56–0.6) psi/ft. development driven by the complicated geology of the Perth
Generally, the penetration drilling rate decreases as Basin. Fluid expansion and later tectonic loading have con-
depth increases, as shown in Figure 7.21. however, ROP tributed to different extents to overpressure development.
increased at the same depth where sonic, resistivity, and The analysis of wireline logs, cross‐plots of well log data,
porosity logs deviated. This is an additional indicator for and the study of compositional variations imply that the fluid
overpressure, supported by the data taken from the drilling expansion mechanism plays an important role in the buildup
report, which showed no changes in rotary speed and of overpressure. The later tectonic loading is also believed to