Page 312 - Fundamentals of Gas Shale Reservoirs
P. 312

292   PERFORMANCE ANALYSIS OF UNCONVENTIONAL SHALE RESERVOIRS

                               40
                                            Well data
                                    B o  2.744 RB/STB  h y  191 ft
                                    B g  0.55 RB/MSCF  f  175 ft
                                    B w  1.057 RB/STB  n f  18
                               30     t  0.089  –5    o g  0.127 cp

                                                      0.0325 cp
                                    C
                              p (q o B o  + q w B w  + q g B g ), psi/rb/d  20
                                      1.12 × 10 1/psi


                               10


                              –10 0
                                  0                    2                   4                    6
                                                            4 √ Time, √ day
                                                                  4
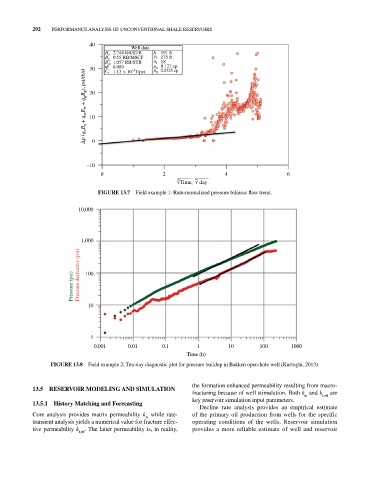
                                 FIgURE 13.7  Field example 1: Rate‐normalized pressure bilinear flow trend.

                           10,000


                            1,000


                         Pressure (psi)  Pressure derivative (psi)  100


                              10


                               1
                                0.001      0.01        0.1        1          10        100       1000
                                                               Time (h)
                  FIgURE 13.8  Field example 2: Ten‐day diagnostic plot for pressure buildup in Bakken open‐hole well (Kurtoglu, 2013).


                                                                 the formation enhanced permeability resulting from macro-
            13.5  RESERVOIR MODELINg AND SIMULATION
                                                                 fracturing because of well stimulation. Both k  and k  are
                                                                                                      m
                                                                                                            f,eff
                                                                 key reservoir simulation input parameters.
            13.5.1  History Matching and Forecasting
                                                                   Decline rate analysis  provides  an  empirical  estimate
            Core analysis provides matrix permeability k  while rate‐  of the primary oil production from wells for the specific
                                                 m
            transient analysis yields a numerical value for fracture effec-  operating  conditions of  the wells. Reservoir  simulation
            tive permeability k . The latter permeability is, in reality,   provides a more reliable estimate of well and reservoir

                           f,eff
   307   308   309   310   311   312   313   314   315   316   317