
Page 197 - Fundamentals of Geomorphology
P. 197
180 PROCESS AND FORM
where E is the mean annual rainfall loss, R is the rain- a bare fallow land-use ploughed up and down the slope
fall erosivity factor, K is the soil erodibility factor, L is – seem very arbitrary and indeed are historical acci-
the slope length factor, S is the slope steepness fac- dents. They are derived from the condition common
tor, C is the crop management factor, and P is the at experimental fieldstations wheremeasuredsoillosses
erosion control practice factor. The rainfall erosivity provided the basic data for calibrating the equation. It
factor is often expressed as a rainfall erosion index, was convenient to use a plot area of 1/100 acre and a
EI 30 , where E is rainstorm energy and I is rainfall plot width of 6 feet, which meant that the plot length
intensity during a specified period, usually 30 min- must be 72 /2 feet.
1
utes. Soil erodibility, K , is defined as the erosion rate To use the USLE, a range of erosion measure-
(per unit of erosion index, EI 30 ) on a specific soil in a ments must be made, which are usually taken on small
cultivated continuous fallow on a 9 per cent slope on bounded plots. The problem here is that the plot itself
a plot 22.6-m-long. Slope length, L, and slope steep- affects the erosion rate. On small plots, all material that
ness, S, are commonly combined to produce a single starts to move is collected and measured. Moreover,
index, LS, that represents the ratio of soil loss under the evacuation of water and sediment at the slope base
a given slope steepness and slope length to the soil may itself trigger erosion, with rills eating back through
loss from a standard 9 per cent, 22.6-m-long slope. the plot, picking up and transporting new sources of
Crop management, C, is given as the ratio of soil sediment in the process. Another difficulty lies in the
loss from a field with a specific cropping-management assumption that actual slopes are uniform and behave
strategy compared with the standard continuous cul- like small plots. Natural slopes usually have a complex
tivated fallow. Erosion control, P, is the ratio of soil topography that creates local erosion and deposition of
loss with contouring strip cultivation or terracing to sediment. For these reasons, erosion plots established
that of straight-row, up-and-down slope farming sys- to provide the empirical data needed to apply the USLE
tems. The measurements of the standard plot – a slope almost always overestimate the soil-loss rate from
length of 22.6 m (72 /2 feet), 9 per cent gradient, with hillslopes by a factor twice to ten times the natural rate.
1
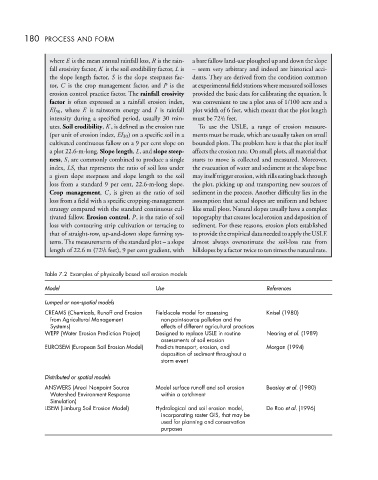
Table 7.2 Examples of physically based soil erosion models
Model Use References
Lumped or non-spatial models
CREAMS (Chemicals, Runoff and Erosion Field-scale model for assessing Knisel (1980)
from Agricultural Management non-point-source pollution and the
Systems) effects of different agricultural practices
WEPP (Water Erosion Prediction Project) Designed to replace USLE in routine Nearing et al. (1989)
assessments of soil erosion
EUROSEM (European Soil Erosion Model) Predicts transport, erosion, and Morgan (1994)
deposition of sediment throughout a
storm event
Distributed or spatial models
ANSWERS (Areal Nonpoint Source Model surface runoff and soil erosion Beasley et al. (1980)
Watershed Environment Response within a catchment
Simulation)
LISEM (Limburg Soil Erosion Model) Hydrological and soil erosion model, De Roo et al. (1996)
incorporating raster GIS, that may be
used for planning and conservation
purposes