
Page 172 - Fundamentals of Light Microscopy and Electronic Imaging
P. 172
THE DIC OPTICAL SYSTEM 155
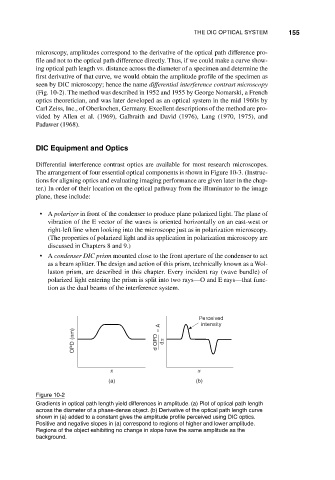
microscopy, amplitudes correspond to the derivative of the optical path difference pro-
file and not to the optical path difference directly. Thus, if we could make a curve show-
ing optical path length vs. distance across the diameter of a specimen and determine the
first derivative of that curve, we would obtain the amplitude profile of the specimen as
seen by DIC microscopy; hence the name differential interference contrast microscopy
(Fig. 10-2). The method was described in 1952 and 1955 by George Nomarski, a French
optics theoretician, and was later developed as an optical system in the mid 1960s by
Carl Zeiss, Inc., of Oberkochen, Germany. Excellent descriptions of the method are pro-
vided by Allen et al. (1969), Galbraith and David (1976), Lang (1970, 1975), and
Padawer (1968).
DIC Equipment and Optics
Differential interference contrast optics are available for most research microscopes.
The arrangement of four essential optical components is shown in Figure 10-3. (Instruc-
tions for aligning optics and evaluating imaging performance are given later in the chap-
ter.) In order of their location on the optical pathway from the illuminator to the image
plane, these include:
•A polarizer in front of the condenser to produce plane polarized light. The plane of
vibration of the E vector of the waves is oriented horizontally on an east-west or
right-left line when looking into the microscope just as in polarization microscopy.
(The properties of polarized light and its application in polarization microscopy are
discussed in Chapters 8 and 9.)
•A condenser DIC prism mounted close to the front aperture of the condenser to act
as a beam splitter. The design and action of this prism, technically known as a Wol-
laston prism, are described in this chapter. Every incident ray (wave bundle) of
polarized light entering the prism is split into two rays—O and E rays—that func-
tion as the dual beams of the interference system.
Perceived
intensity
OPD (nm) d OPD ≈ A dx
x x
(a) (b)
Figure 10-2
Gradients in optical path length yield differences in amplitude. (a) Plot of optical path length
across the diameter of a phase-dense object. (b) Derivative of the optical path length curve
shown in (a) added to a constant gives the amplitude profile perceived using DIC optics.
Positive and negative slopes in (a) correspond to regions of higher and lower amplitude.
Regions of the object exhibiting no change in slope have the same amplitude as the
background.