
Page 264 - Fundamentals of Light Microscopy and Electronic Imaging
P. 264
CRITERIA USED TO DEFINE VIDEO IMAGING PERFORMANCE 247
(a)
(b)
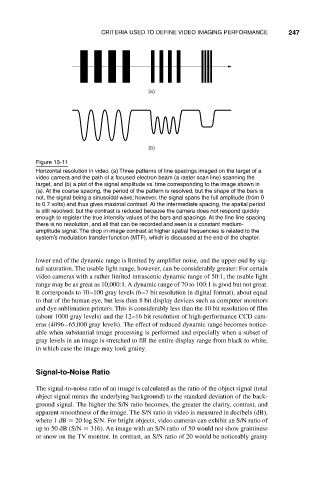
Figure 13-11
Horizontal resolution in video. (a) Three patterns of line spacings imaged on the target of a
video camera and the path of a focused electron beam (a raster scan line) scanning the
target, and (b) a plot of the signal amplitude vs. time corresponding to the image shown in
(a). At the coarse spacing, the period of the pattern is resolved, but the shape of the bars is
not, the signal being a sinusoidal wave; however, the signal spans the full amplitude (from 0
to 0.7 volts) and thus gives maximal contrast. At the intermediate spacing, the spatial period
is still resolved, but the contrast is reduced because the camera does not respond quickly
enough to register the true intensity values of the bars and spacings. At the fine line spacing
there is no resolution, and all that can be recorded and seen is a constant medium-
amplitude signal. The drop in image contrast at higher spatial frequencies is related to the
system’s modulation transfer function (MTF), which is discussed at the end of the chapter.
lower end of the dynamic range is limited by amplifier noise, and the upper end by sig-
nal saturation. The usable light range, however, can be considerably greater: For certain
video cameras with a rather limited intrascenic dynamic range of 50:1, the usable light
range may be as great as 10,000:1. A dynamic range of 70 to 100:1 is good but not great.
It corresponds to 70–100 gray levels (6–7 bit resolution in digital format), about equal
to that of the human eye, but less than 8 bit display devices such as computer monitors
and dye sublimation printers. This is considerably less than the 10 bit resolution of film
(about 1000 gray levels) and the 12–16 bit resolution of high-performance CCD cam-
eras (4096–65,000 gray levels). The effect of reduced dynamic range becomes notice-
able when substantial image processing is performed and especially when a subset of
gray levels in an image is stretched to fill the entire display range from black to white,
in which case the image may look grainy.
Signal-to-Noise Ratio
The signal-to-noise ratio of an image is calculated as the ratio of the object signal (total
object signal minus the underlying background) to the standard deviation of the back-
ground signal. The higher the S/N ratio becomes, the greater the clarity, contrast, and
apparent smoothness of the image. The S/N ratio in video is measured in decibels (dB),
where 1 dB 20 log S/N. For bright objects, video cameras can exhibit an S/N ratio of
up to 50 dB (S/N 316). An image with an S/N ratio of 50 would not show graininess
or snow on the TV monitor. In contrast, an S/N ratio of 20 would be noticeably grainy