
Page 314 - Fundamentals of Light Microscopy and Electronic Imaging
P. 314
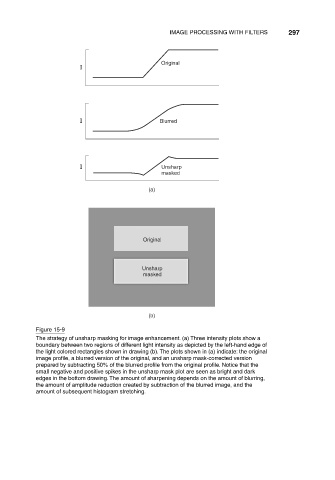
IMAGE PROCESSING WITH FILTERS      297


                                                            Original
                                    I


                                    I                       Blurred


                                    I                       Unsharp
                                                            masked

                                                        (a)


                                                       Original


                                                      Unsharp
                                                       masked


                                                        (b)
                       Figure 15-9
                       The strategy of unsharp masking for image enhancement. (a) Three intensity plots show a
                       boundary between two regions of different light intensity as depicted by the left-hand edge of
                       the light colored rectangles shown in drawing (b). The plots shown in (a) indicate: the original
                       image profile, a blurred version of the original, and an unsharp mask-corrected version
                       prepared by subtracting 50% of the blurred profile from the original profile. Notice that the
                       small negative and positive spikes in the unsharp mask plot are seen as bright and dark
                       edges in the bottom drawing. The amount of sharpening depends on the amount of blurring,
                       the amount of amplitude reduction created by subtraction of the blurred image, and the
                       amount of subsequent histogram stretching.