
Page 317 - Fundamentals of Light Microscopy and Electronic Imaging
P. 317
300 DIGITAL IMAGE PROCESSING
18:1 12:1 3:1
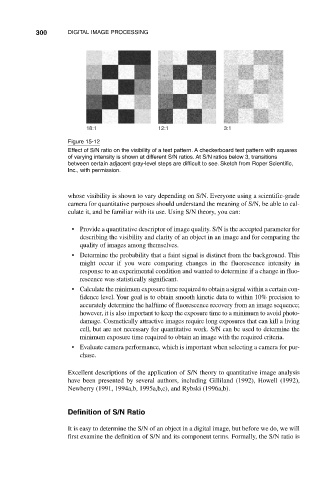
Figure 15-12
Effect of S/N ratio on the visibility of a test pattern. A checkerboard test pattern with squares
of varying intensity is shown at different S/N ratios. At S/N ratios below 3, transitions
between certain adjacent gray-level steps are difficult to see. Sketch from Roper Scientific,
Inc., with permission.
whose visibility is shown to vary depending on S/N. Everyone using a scientific-grade
camera for quantitative purposes should understand the meaning of S/N, be able to cal-
culate it, and be familiar with its use. Using S/N theory, you can:
• Provide a quantitative descriptor of image quality. S/N is the accepted parameter for
describing the visibility and clarity of an object in an image and for comparing the
quality of images among themselves.
• Determine the probability that a faint signal is distinct from the background. This
might occur if you were comparing changes in the fluorescence intensity in
response to an experimental condition and wanted to determine if a change in fluo-
rescence was statistically significant.
• Calculate the minimum exposure time required to obtain a signal within a certain con-
fidence level. Your goal is to obtain smooth kinetic data to within 10% precision to
accurately determine the halftime of fluorescence recovery from an image sequence;
however, it is also important to keep the exposure time to a minimum to avoid photo-
damage. Cosmetically attractive images require long exposures that can kill a living
cell, but are not necessary for quantitative work. S/N can be used to determine the
minimum exposure time required to obtain an image with the required criteria.
• Evaluate camera performance, which is important when selecting a camera for pur-
chase.
Excellent descriptions of the application of S/N theory to quantitative image analysis
have been presented by several authors, including Gilliland (1992), Howell (1992),
Newberry (1991, 1994a,b, 1995a,b,c), and Rybski (1996a,b).
Definition of S/N Ratio
It is easy to determine the S/N of an object in a digital image, but before we do, we will
first examine the definition of S/N and its component terms. Formally, the S/N ratio is