
Page 321 - Fundamentals of Light Microscopy and Electronic Imaging
P. 321
304 DIGITAL IMAGE PROCESSING
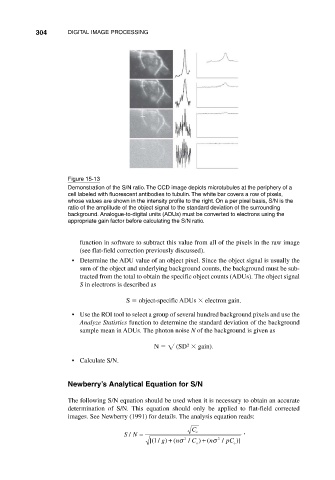
Figure 15-13
Demonstration of the S/N ratio. The CCD image depicts microtubules at the periphery of a
cell labeled with fluorescent antibodies to tubulin. The white bar covers a row of pixels,
whose values are shown in the intensity profile to the right. On a per pixel basis, S/N is the
ratio of the amplitude of the object signal to the standard deviation of the surrounding
background. Analogue-to-digital units (ADUs) must be converted to electrons using the
appropriate gain factor before calculating the S/N ratio.
function in software to subtract this value from all of the pixels in the raw image
(see flat-field correction previously discussed).
• Determine the ADU value of an object pixel. Since the object signal is usually the
sum of the object and underlying background counts, the background must be sub-
tracted from the total to obtain the specific object counts (ADUs). The object signal
S in electrons is described as
S object-specific ADUs electron gain.
• Use the ROI tool to select a group of several hundred background pixels and use the
Analyze Statistics function to determine the standard deviation of the background
sample mean in ADUs. The photon noise N of the background is given as
2
N (SD gain).
• Calculate S/N.
Newberry’s Analytical Equation for S/N
The following S/N equation should be used when it is necessary to obtain an accurate
determination of S/N. This equation should only be applied to flat-field corrected
images. See Newberry (1991) for details. The analysis equation reads:
C
SN = o ,
/
1
[( / g) (+ nσ 2 / C ) (+ nσ 2 / pC )]
o o