
Page 320 - Fundamentals of Light Microscopy and Electronic Imaging
P. 320
SIGNAL-TO-NOISE RATIO 303
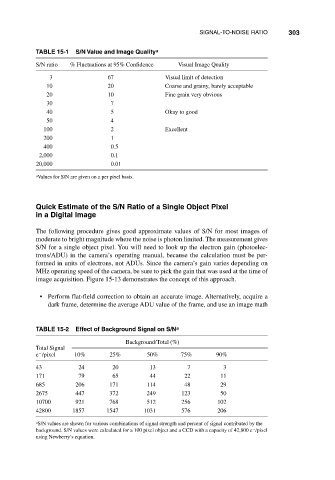
TABLE 15-1 S/N Value and Image Quality a
S/N ratio % Fluctuations at 95% Confidence Visual Image Quality
3 67 Visual limit of detection
10 20 Coarse and grainy, barely acceptable
20 10 Fine grain very obvious
30 7
40 5 Okay to good
50 4
100 2 Excellent
200 1
400 0.5
2,000 0.1
20,000 0.01
a Values for S/N are given on a per pixel basis.
Quick Estimate of the S/N Ratio of a Single Object Pixel
in a Digital Image
The following procedure gives good approximate values of S/N for most images of
moderate to bright magnitude where the noise is photon limited. The measurement gives
S/N for a single object pixel. You will need to look up the electron gain (photoelec-
trons/ADU) in the camera’s operating manual, because the calculation must be per-
formed in units of electrons, not ADUs. Since the camera’s gain varies depending on
MHz operating speed of the camera, be sure to pick the gain that was used at the time of
image acquisition. Figure 15-13 demonstrates the concept of this approach.
• Perform flat-field correction to obtain an accurate image. Alternatively, acquire a
dark frame, determine the average ADU value of the frame, and use an image math
TABLE 15-2 Effect of Background Signal on S/N a
Background/Total (%)
Total Signal
e /pixel 10% 25% 50% 75% 90%
43 24 20 13 7 3
171 79 65 44 22 11
685 206 171 114 48 29
2675 447 372 249 123 50
10700 921 768 512 256 102
42800 1857 1547 1031 576 206
a S/N values are shown for various combinations of signal strength and percent of signal contributed by the
background. S/N values were calculated for a 100 pixel object and a CCD with a capacity of 42,800 e /pixel
using Newberry’s equation.