
Page 169 - Fundamentals of Ocean Renewable Energy Generating Electricity From The Sea
P. 169
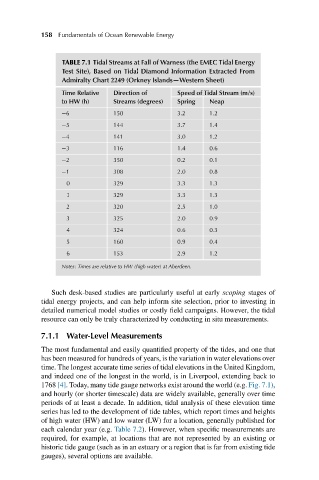
158 Fundamentals of Ocean Renewable Energy


                  TABLE 7.1 Tidal Streams at Fall of Warness (the EMEC Tidal Energy
                  Test Site), Based on Tidal Diamond Information Extracted From
                  Admiralty Chart 2249 (Orkney Islands—Western Sheet)
                  Time Relative  Direction of    Speed of Tidal Stream (m/s)
                  to HW (h)     Streams (degrees)  Spring  Neap
                  −6            150              3.2      1.2
                  −5            144              3.7      1.4
                  −4            141              3.0      1.2
                  −3            116              1.4      0.6
                  −2            350              0.2      0.1
                  −1            308              2.0      0.8
                   0            329              3.3      1.3
                   1            329              3.3      1.3
                   2            320              2.5      1.0
                   3            325              2.0      0.9
                   4            324              0.6      0.3
                   5            160              0.9      0.4
                   6            153              2.9      1.2
                  Notes: Times are relative to HW (high water) at Aberdeen.


               Such desk-based studies are particularly useful at early scoping stages of
            tidal energy projects, and can help inform site selection, prior to investing in
            detailed numerical model studies or costly field campaigns. However, the tidal
            resource can only be truly characterized by conducting in situ measurements.

            7.1.1 Water-Level Measurements
            The most fundamental and easily quantified property of the tides, and one that
            has been measured for hundreds of years, is the variation in water elevations over
            time. The longest accurate time series of tidal elevations in the United Kingdom,
            and indeed one of the longest in the world, is in Liverpool, extending back to
            1768 [4]. Today, many tide gauge networks exist around the world (e.g. Fig. 7.1),
            and hourly (or shorter timescale) data are widely available, generally over time
            periods of at least a decade. In addition, tidal analysis of these elevation time
            series has led to the development of tide tables, which report times and heights
            of high water (HW) and low water (LW) for a location, generally published for
            each calendar year (e.g. Table 7.2). However, when specific measurements are
            required, for example, at locations that are not represented by an existing or
            historic tide gauge (such as in an estuary or a region that is far from existing tide
            gauges), several options are available.