
Page 171 - Fundamentals of Ocean Renewable Energy Generating Electricity From The Sea
P. 171
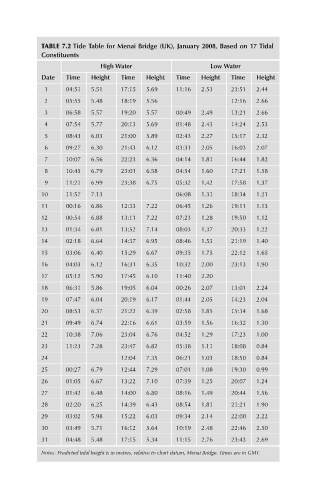
TABLE 7.2 Tide Table for Menai Bridge (UK), January 2008, Based on 17 Tidal
            Constituents
                            High Water                    Low Water
            Date   Time   Height  Time   Height  Time  Height  Time   Height
             1     04:51  5.51    17:15  5.69    11:16  2.53   23:51  2.44
             2     05:55  5.48    18:19  5.56                  12:16  2.66
             3     06:58  5.57    19:20  5.57    00:49  2.49   13:21  2.66
             4     07:54  5.77    20:13  5.69    01:48  2.43   14:24  2.53
             5     08:43  6.03    21:00  5.89    02:43  2.27   15:17  2.32
             6     09:27  6.30    21:43  6.12    03:31  2.05   16:03  2.07
             7     10:07  6.56    22:23  6.36    04:14  1.81   16:44  1.82
             8     10:45  6.79    23:01  6.58    04:54  1.60   17:21  1.58
             9     11:21  6.99    23:38  6.75    05:32  1.42   17:58  1.37
            10     11:57  7.13                   06:08  1.31   18:34  1.21
            11     00:16  6.86    12:33  7.22    06:45  1.26   19:11  1.13
            12     00:54  6.88    13:11  7.22    07:23  1.28   19:50  1.12
            13     01:34  6.81    13:52  7.14    08:03  1.37   20:33  1.22
            14     02:18  6.64    14:37  6.95    08:46  1.53   21:19  1.40
            15     03:06  6.40    15:29  6.67    09:35  1.75   22:12  1.65
            16     04:03  6.12    16:31  6.35    10:32  2.00   23:13  1.90
            17     05:12  5.90    17:45  6.10    11:40  2.20
            18     06:31  5.86    19:05  6.04    00:26  2.07   13:01  2.24
            19     07:47  6.04    20:19  6.17    01:44  2.05   14:23  2.04
            20     08:53  6.37    21:22  6.39    02:58  1.85   15:34  1.68
            21     09:49  6.74    22:16  6.61    03:59  1.56   16:32  1.30
            22     10:38  7.06    23:04  6.76    04:52  1.29   17:23  1.00
            23     11:23  7.28    23:47  6.82    05:38  1.11   18:08  0.84
            24                    12:04  7.35    06:21  1.03   18:50  0.84
            25     00:27  6.79    12:44  7.29    07:01  1.08   19:30  0.99
            26     01:05  6.67    13:22  7.10    07:39  1.25   20:07  1.24
            27     01:42  6.48    14:00  6.80    08:16  1.49   20:44  1.56
            28     02:20  6.25    14:39  6.43    08:54  1.81   21:21  1.90
            29     03:02  5.98    15:22  6.03    09:34  2.14   22:00  2.22
            30     03:49  5.71    16:12  5.64    10:19  2.48   22:46  2.50
            31     04:48  5.48    17:15  5.34    11:15  2.76   23:43  2.69
            Notes: Predicted tidal height is in metres, relative to chart datum, Menai Bridge. Times are in GMT.