
Page 234 - Fundamentals of Ocean Renewable Energy Generating Electricity From The Sea
P. 234
Ocean Modelling for Resource Characterization Chapter | 8 223
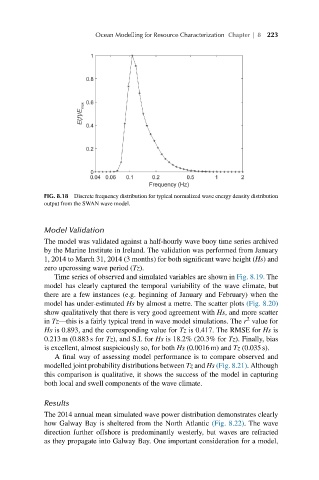
FIG. 8.18 Discrete frequency distribution for typical normalized wave energy density distribution
output from the SWAN wave model.
Model Validation
The model was validated against a half-hourly wave buoy time series archived
by the Marine Institute in Ireland. The validation was performed from January
1, 2014 to March 31, 2014 (3 months) for both significant wave height (Hs) and
zero upcrossing wave period (Tz).
Time series of observed and simulated variables are shown in Fig. 8.19. The
model has clearly captured the temporal variability of the wave climate, but
there are a few instances (e.g. beginning of January and February) when the
model has under-estimated Hs by almost a metre. The scatter plots (Fig. 8.20)
show qualitatively that there is very good agreement with Hs, and more scatter
2
in Tz—this is a fairly typical trend in wave model simulations. The r value for
Hs is 0.893, and the corresponding value for Tz is 0.417. The RMSE for Hs is
0.213 m (0.883 s for Tz), and S.I. for Hs is 18.2% (20.3% for Tz). Finally, bias
is excellent, almost suspiciously so, for both Hs (0.0016 m) and Tz (0.035 s).
A final way of assessing model performance is to compare observed and
modelled joint probability distributions between Tz and Hs (Fig. 8.21). Although
this comparison is qualitative, it shows the success of the model in capturing
both local and swell components of the wave climate.
Results
The 2014 annual mean simulated wave power distribution demonstrates clearly
how Galway Bay is sheltered from the North Atlantic (Fig. 8.22). The wave
direction further offshore is predominantly westerly, but waves are refracted
as they propagate into Galway Bay. One important consideration for a model,