
Page 239 - Fundamentals of Ocean Renewable Energy Generating Electricity From The Sea
P. 239
228 Fundamentals of Ocean Renewable Energy
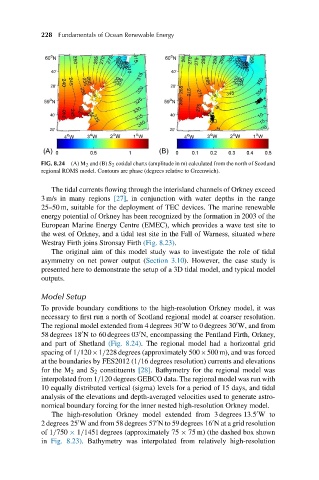
FIG. 8.24 (A) M 2 and (B) S 2 cotidal charts (amplitude in m) calculated from the north of Scotland
regional ROMS model. Contours are phase (degrees relative to Greenwich).
The tidal currents flowing through the interisland channels of Orkney exceed
3 m/s in many regions [27], in conjunction with water depths in the range
25–50 m, suitable for the deployment of TEC devices. The marine renewable
energy potential of Orkney has been recognized by the formation in 2003 of the
European Marine Energy Centre (EMEC), which provides a wave test site to
the west of Orkney, and a tidal test site in the Fall of Warness, situated where
Westray Firth joins Stronsay Firth (Fig. 8.23).
The original aim of this model study was to investigate the role of tidal
asymmetry on net power output (Section 3.10). However, the case study is
presented here to demonstrate the setup of a 3D tidal model, and typical model
outputs.
Model Setup
To provide boundary conditions to the high-resolution Orkney model, it was
necessary to first run a north of Scotland regional model at coarser resolution.
The regional model extended from 4 degrees 30 W to 0 degrees 30 W, and from
58 degrees 18 N to 60 degrees 03 N, encompassing the Pentland Firth, Orkney,
and part of Shetland (Fig. 8.24). The regional model had a horizontal grid
spacing of 1/120×1/228 degrees (approximately 500×500 m), and was forced
at the boundaries by FES2012 (1/16 degrees resolution) currents and elevations
for the M 2 and S 2 constituents [28]. Bathymetry for the regional model was
interpolated from 1/120 degrees GEBCO data. The regional model was run with
10 equally distributed vertical (sigma) levels for a period of 15 days, and tidal
analysis of the elevations and depth-averaged velocities used to generate astro-
nomical boundary forcing for the inner nested high-resolution Orkney model.
The high-resolution Orkney model extended from 3 degrees 13.5 Wto
2 degrees 25 W and from 58 degrees 57 N to 59 degrees 16 N at a grid resolution
of 1/750 × 1/1451 degrees (approximately 75 × 75 m) (the dashed box shown
in Fig. 8.23). Bathymetry was interpolated from relatively high-resolution