
Page 240 - Fundamentals of Ocean Renewable Energy Generating Electricity From The Sea
P. 240
Ocean Modelling for Resource Characterization Chapter | 8 229
(approximately 200 m) gridded multibeam data provided by St. Andrew’s
University. The model domain encompasses the principal high tidal flow regions
of Orkney, including Westray Firth and Stronsay Firth, and the EMEC tidal test
site at the Fall of Warness. The model configuration used the GLS turbulence
model, tuned to represent the k-ε model, and included horizontal harmonic
mixing to provide subgrid scale dissipation of momentum [29], and quadratic
bottom friction, with a drag coefficient C D = 0.003. This value for the drag
coefficient is consistent with previous ROMS studies which simulate the flow
through energetic tidal channels, and these studies have demonstrated that the
ROMS model is not particularly sensitive to the value of C D [30,31]. The model
was again run with 10 vertical levels for a period of 15 days.
Results
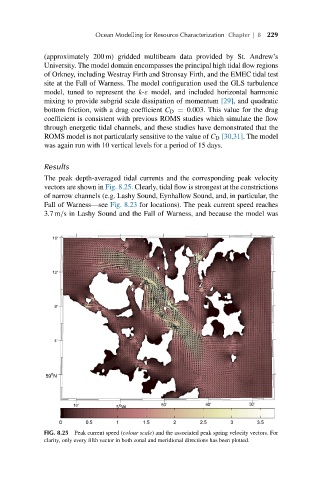
The peak depth-averaged tidal currents and the corresponding peak velocity
vectors are shown in Fig. 8.25. Clearly, tidal flow is strongest at the constrictions
of narrow channels (e.g. Lashy Sound, Eynhallow Sound, and, in particular, the
Fall of Warness—see Fig. 8.23 for locations). The peak current speed reaches
3.7 m/s in Lashy Sound and the Fall of Warness, and because the model was
FIG. 8.25 Peak current speed (colour scale) and the associated peak spring velocity vectors. For
clarity, only every fifth vector in both zonal and meridional directions has been plotted.