
Page 244 - Fundamentals of Ocean Renewable Energy Generating Electricity From The Sea
P. 244
Ocean Modelling for Resource Characterization Chapter | 8 233
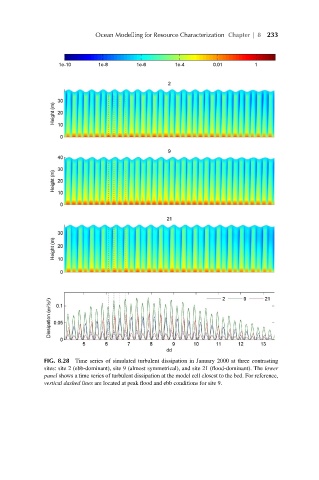
FIG. 8.28 Time series of simulated turbulent dissipation in January 2000 at three contrasting
sites: site 2 (ebb-dominant), site 9 (almost symmetrical), and site 21 (flood-dominant). The lower
panel shows a time series of turbulent dissipation at the model cell closest to the bed. For reference,
vertical dashed lines are located at peak flood and ebb conditions for site 9.