
Page 242 - Fundamentals of Ocean Renewable Energy Generating Electricity From The Sea
P. 242
Ocean Modelling for Resource Characterization Chapter | 8 231
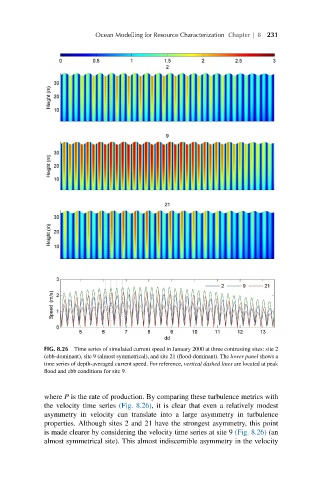
FIG. 8.26 Time series of simulated current speed in January 2000 at three contrasting sites: site 2
(ebb-dominant), site 9 (almost symmetrical), and site 21 (flood-dominant). The lower panel shows a
time series of depth-averaged current speed. For reference, vertical dashed lines are located at peak
flood and ebb conditions for site 9.
where P is the rate of production. By comparing these turbulence metrics with
the velocity time series (Fig. 8.26), it is clear that even a relatively modest
asymmetry in velocity can translate into a large asymmetry in turbulence
properties. Although sites 2 and 21 have the strongest asymmetry, this point
is made clearer by considering the velocity time series at site 9 (Fig. 8.26) (an
almost symmetrical site). This almost indiscernible asymmetry in the velocity