
Page 262 - Fundamentals of Radar Signal Processing
P. 262
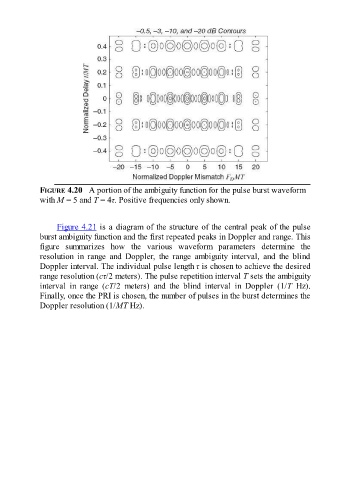
FIGURE 4.20   A portion of the ambiguity function for the pulse burst waveform
               with M = 5 and T = 4τ. Positive frequencies only shown.


                     Figure 4.21 is a diagram of the structure of the central peak of the pulse
               burst ambiguity function and the first repeated peaks in Doppler and range. This
               figure  summarizes  how  the  various  waveform  parameters  determine  the

               resolution  in  range  and  Doppler,  the  range  ambiguity  interval,  and  the  blind
               Doppler interval. The individual pulse length τ is chosen to achieve the desired
               range resolution (cτ/2 meters). The pulse repetition interval T sets the ambiguity
               interval  in  range  (cT/2  meters)  and  the  blind  interval  in  Doppler  (1/T  Hz).
               Finally, once the PRI is chosen, the number of pulses in the burst determines the
               Doppler resolution (1/MT Hz).