
Page 261 - Fundamentals of Radar Signal Processing
P. 261
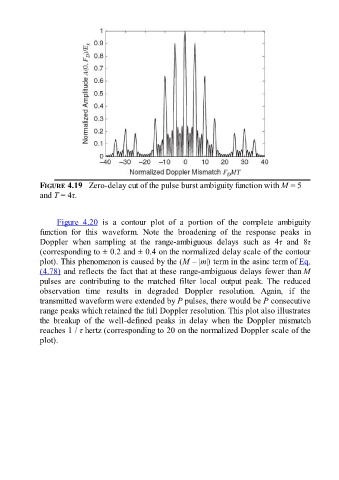
FIGURE 4.19   Zero-delay cut of the pulse burst ambiguity function with M = 5
               and T = 4τ.


                     Figure  4.20  is  a  contour  plot  of  a  portion  of  the  complete  ambiguity
               function  for  this  waveform.  Note  the  broadening  of  the  response  peaks  in
               Doppler  when  sampling  at  the  range-ambiguous  delays  such  as  4τ  and  8τ
               (corresponding to ± 0.2 and ± 0.4 on the normalized delay scale of the contour

               plot). This phenomenon is caused by the (M – |m|) term in the asinc term of Eq.
               (4.78) and reflects the fact that at these range-ambiguous delays fewer than M
               pulses  are  contributing  to  the  matched  filter  local  output  peak.  The  reduced
               observation  time  results  in  degraded  Doppler  resolution.  Again,  if  the
               transmitted waveform were extended by P pulses, there would be P consecutive
               range peaks which retained the full Doppler resolution. This plot also illustrates

               the  breakup  of  the  well-defined  peaks  in  delay  when  the  Doppler  mismatch
               reaches 1 / τ hertz (corresponding to 20 on the normalized Doppler scale of the
               plot).