
Page 483 - Fundamentals of Radar Signal Processing
P. 483
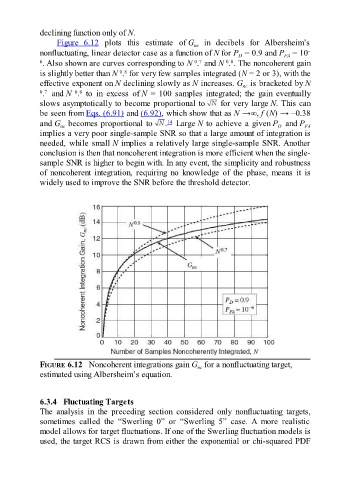
declining function only of N.

                     Figure  6.12  plots  this  estimate  of G   in  decibels  for  Albersheim’s
                                                                     nc
               nonfluctuating, linear detector case as a function of N for P  = 0.9 and P  = 10              –
                                                                                                     FA
                                                                                     D
               6 . Also shown are curves corresponding to N  .  and N  . . The noncoherent gain
                                                                     0 7
                                                                                0 8
                                           0 8
               is slightly better than N  .  for very few samples integrated (N = 2 or 3), with the
               effective exponent on N declining slowly as N increases. G  is bracketed by N
                                                                                      nc
               0 7         0 8
                .   and N  .   to  in  excess  of N  =  100  samples  integrated;  the  gain  eventually
               slows asymptotically to become proportional to                 for very large N. This can
               be seen from Eqs. (6.91) and (6.92), which show that as N →∞, f (N) → –0.38
                                                            14
               and G  becomes proportional to              .   Large N to achieve a given P   and P         FA
                      nc
                                                                                                   D
               implies a very poor single-sample SNR so that a large amount of integration is
               needed, while small N implies a relatively large single-sample SNR. Another
               conclusion is then that noncoherent integration is more efficient when the single-
               sample SNR is higher to begin with. In any event, the simplicity and robustness
               of  noncoherent  integration,  requiring  no  knowledge  of  the  phase,  means  it  is
               widely used to improve the SNR before the threshold detector.


               FIGURE 6.12   Noncoherent integrations gain G  for a nonfluctuating target,
                                                                      nc
               estimated using Albersheim’s equation.


               6.3.4   Fluctuating Targets

               The  analysis  in  the  preceding  section  considered  only  nonfluctuating  targets,
               sometimes  called  the  “Swerling  0”  or  “Swerling  5”  case.  A  more  realistic
               model allows for target fluctuations. If one of the Swerling fluctuation models is
               used, the target RCS is drawn from either the exponential or chi-squared PDF