
Page 488 - Fundamentals of Radar Signal Processing
P. 488
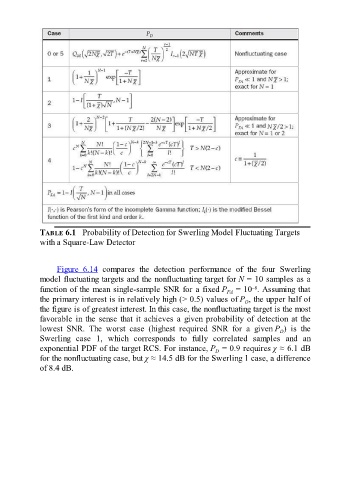
TABLE 6.1   Probability of Detection for Swerling Model Fluctuating Targets
               with a Square-Law Detector


                     Figure  6.14  compares  the  detection  performance  of  the  four  Swerling
               model fluctuating targets and the nonfluctuating target for N = 10 samples as a

                                                                                          –8
               function of the mean single-sample SNR for a fixed P  = 10 . Assuming that
                                                                                 FA
               the primary interest is in relatively high (> 0.5) values of P , the upper half of
                                                                                       D
               the figure is of greatest interest. In this case, the nonfluctuating target is the most
               favorable in the sense that it achieves a given probability of detection at the
               lowest  SNR.  The  worst  case  (highest  required  SNR  for  a  given P )  is  the
                                                                                                   D
               Swerling  case  1,  which  corresponds  to  fully  correlated  samples  and  an
               exponential PDF of the target RCS. For instance, P  = 0.9 requires χ ≈ 6.1 dB
                                                                             D
               for the nonfluctuating case, but χ ≈ 14.5 dB for the Swerling 1 case, a difference
               of 8.4 dB.