
Page 489 - Fundamentals of Radar Signal Processing
P. 489
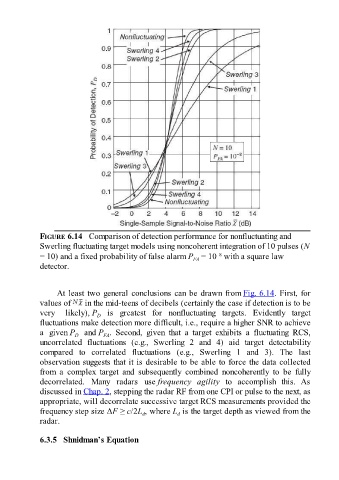
FIGURE 6.14   Comparison of detection performance for nonfluctuating and
               Swerling fluctuating target models using noncoherent integration of 10 pulses (N

                                                                             –8
               = 10) and a fixed probability of false alarm P  = 10  with a square law
                                                                     FA
               detector.


                     At least two general conclusions can be drawn from Fig. 6.14. First, for
               values of       in the mid-teens of decibels (certainly the case if detection is to be
               very  likely), P   is  greatest  for  nonfluctuating  targets.  Evidently  target
                                   D
               fluctuations make detection more difficult, i.e., require a higher SNR to achieve
               a  given P   and P .  Second,  given  that  a  target  exhibits  a  fluctuating  RCS,
                           D
                                     FA
               uncorrelated  fluctuations  (e.g.,  Swerling  2  and  4)  aid  target  detectability
               compared  to  correlated  fluctuations  (e.g.,  Swerling  1  and  3).  The  last

               observation suggests that it is desirable to be able to force the data collected
               from  a  complex  target  and  subsequently  combined  noncoherently  to  be  fully
               decorrelated.  Many  radars  use frequency  agility  to  accomplish  this.  As
               discussed in Chap. 2, stepping the radar RF from one CPI or pulse to the next, as
               appropriate, will decorrelate successive target RCS measurements provided the
               frequency step size ΔF ≥ c/2L , where L  is the target depth as viewed from the
                                                               d
                                                   d
               radar.


               6.3.5   Shnidman’s Equation