
Page 515 - Fundamentals of Radar Signal Processing
P. 515
part land and part water. When the test cell is at or near the boundary between
two clutter regions having different reflectivities, the statistics in the leading and
lagging window will not be the same. Such clutter edges can cause both false
alarms at the edge and masking of targets near the edge and in the lower-
reflectivity region.
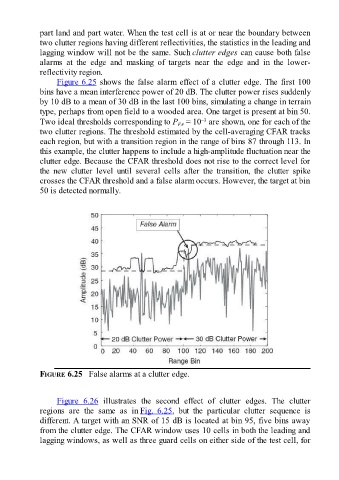
Figure 6.25 shows the false alarm effect of a clutter edge. The first 100
bins have a mean interference power of 20 dB. The clutter power rises suddenly
by 10 dB to a mean of 30 dB in the last 100 bins, simulating a change in terrain
type, perhaps from open field to a wooded area. One target is present at bin 50.
–3
Two ideal thresholds corresponding to P = 10 are shown, one for each of the
FA
two clutter regions. The threshold estimated by the cell-averaging CFAR tracks
each region, but with a transition region in the range of bins 87 through 113. In
this example, the clutter happens to include a high-amplitude fluctuation near the
clutter edge. Because the CFAR threshold does not rise to the correct level for
the new clutter level until several cells after the transition, the clutter spike
crosses the CFAR threshold and a false alarm occurs. However, the target at bin
50 is detected normally.
FIGURE 6.25 False alarms at a clutter edge.
Figure 6.26 illustrates the second effect of clutter edges. The clutter
regions are the same as in Fig. 6.25, but the particular clutter sequence is
different. A target with an SNR of 15 dB is located at bin 95, five bins away
from the clutter edge. The CFAR window uses 10 cells in both the leading and
lagging windows, as well as three guard cells on either side of the test cell, for