
Page 510 - Fundamentals of Radar Signal Processing
P. 510
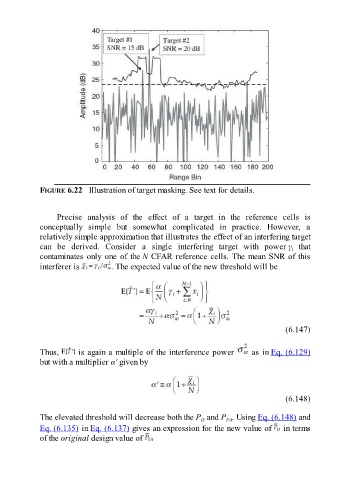
FIGURE 6.22   Illustration of target masking. See text for details.


                     Precise  analysis  of  the  effect  of  a  target  in  the  reference  cells  is
               conceptually  simple  but  somewhat  complicated  in  practice.  However,  a
               relatively simple approximation that illustrates the effect of an interfering target
               can  be  derived.  Consider  a  single  interfering  target  with  power γ   that
                                                                                                       i
               contaminates only one of the N CFAR reference cells. The mean SNR of this
               interferer is            . The expected value of the new threshold will be


                                                                                                     (6.147)

               Thus,        is again a multiple of the interference power                as in Eq. (6.129)

               but with a multiplier α′ given by


                                                                                                     (6.148)

               The elevated threshold will decrease both the P  and P . Using Eq. (6.148) and
                                                                                FA
                                                                        D
               Eq. (6.135) in Eq. (6.137) gives an expression for the new value of   in terms
               of the original design value of