
Page 526 - Fundamentals of Radar Signal Processing
P. 526
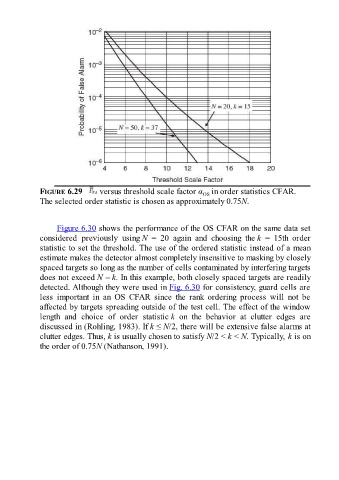
FIGURE 6.29     versus threshold scale factor α  in order statistics CFAR.
                                                                        OS
               The selected order statistic is chosen as approximately 0.75N.


                     Figure 6.30 shows the performance of the OS CFAR on the same data set

               considered  previously  using N  =  20  again  and  choosing  the k  =  15th  order
               statistic to set the threshold. The use of the ordered statistic instead of a mean
               estimate makes the detector almost completely insensitive to masking by closely
               spaced targets so long as the number of cells contaminated by interfering targets
               does not exceed N – k. In this example, both closely spaced targets are readily
               detected. Although they were used in Fig. 6.30 for consistency, guard cells are
               less  important  in  an  OS  CFAR  since  the  rank  ordering  process  will  not  be
               affected by targets spreading outside of the test cell. The effect of the window

               length  and  choice  of  order  statistic k  on  the  behavior  at  clutter  edges  are
               discussed in (Rohling, 1983). If k ≤ N/2, there will be extensive false alarms at
               clutter edges. Thus, k is usually chosen to satisfy N/2 < k < N. Typically, k is on
               the order of 0.75N (Nathanson, 1991).