
Page 522 - Fundamentals of Radar Signal Processing
P. 522
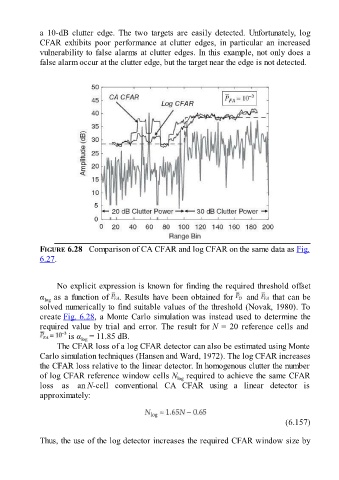
a  10-dB  clutter  edge.  The  two  targets  are  easily  detected.  Unfortunately,  log

               CFAR  exhibits  poor  performance  at  clutter  edges,  in  particular  an  increased
               vulnerability to false alarms at clutter edges. In this example, not only does a
               false alarm occur at the clutter edge, but the target near the edge is not detected.


               FIGURE 6.28   Comparison of CA CFAR and log CFAR on the same data as Fig.
               6.27.


                     No explicit expression is known for finding the required threshold offset
               α  as a function of  . Results have been obtained for    and   that can be
                 log
               solved numerically to find suitable values of the threshold (Novak, 1980). To

               create Fig. 6.28, a Monte Carlo simulation was instead used to determine the
               required  value  by  trial  and  error.  The  result  for N  =  20  reference  cells  and
                         is α  = 11.85 dB.
                              log
                     The CFAR loss of a log CFAR detector can also be estimated using Monte
               Carlo simulation techniques (Hansen and Ward, 1972). The log CFAR increases

               the CFAR loss relative to the linear detector. In homogenous clutter the number
               of log CFAR reference window cells N  required to achieve the same CFAR
                                                               log
               loss  as  an N-cell  conventional  CA  CFAR  using  a  linear  detector  is
               approximately:


                                                                                                     (6.157)

               Thus, the use of the log detector increases the required CFAR window size by