
Page 78 - Fundamentals of Radar Signal Processing
P. 78
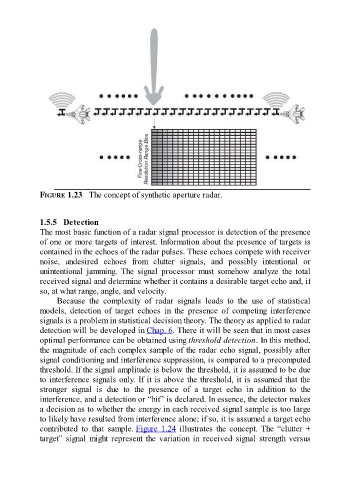
FIGURE 1.23   The concept of synthetic aperture radar.


               1.5.5   Detection
               The most basic function of a radar signal processor is detection of the presence
               of one or more targets of interest. Information about the presence of targets is
               contained in the echoes of the radar pulses. These echoes compete with receiver

               noise,  undesired  echoes  from  clutter  signals,  and  possibly  intentional  or
               unintentional  jamming.  The  signal  processor  must  somehow  analyze  the  total
               received signal and determine whether it contains a desirable target echo and, if
               so, at what range, angle, and velocity.
                     Because  the  complexity  of  radar  signals  leads  to  the  use  of  statistical
               models,  detection  of  target  echoes  in  the  presence  of  competing  interference

               signals is a problem in statistical decision theory. The theory as applied to radar
               detection will be developed in Chap. 6. There it will be seen that in most cases
               optimal performance can be obtained using threshold detection. In this method,
               the magnitude of each complex sample of the radar echo signal, possibly after
               signal conditioning and interference suppression, is compared to a precomputed
               threshold. If the signal amplitude is below the threshold, it is assumed to be due
               to interference signals only. If it is above the threshold, it is assumed that the

               stronger  signal  is  due  to  the  presence  of  a  target  echo  in  addition  to  the
               interference, and a detection or “hit” is declared. In essence, the detector makes
               a decision as to whether the energy in each received signal sample is too large
               to likely have resulted from interference alone; if so, it is assumed a target echo
               contributed  to  that  sample. Figure 1.24 illustrates the concept. The “clutter +
               target”  signal  might  represent  the  variation  in  received  signal  strength  versus