
Page 350 - Fundamentals of Reservoir Engineering
P. 350
REAL GAS FLOW: GAS WELL TESTING 285
2) Flow Analysis
Plots of m(p wf) versus log t for the data listed in table 8.10, are shown as fig. 8.15 (b)
and (c), from which the data presented in table 8.13 have been determined.
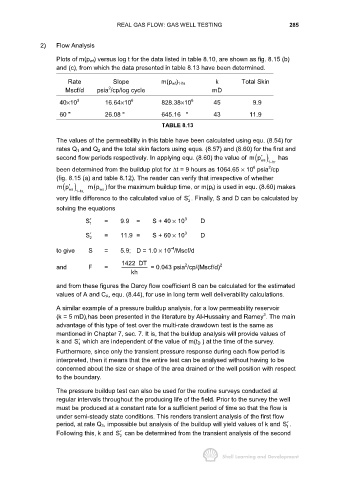
Rate Slope m(p wf) 1-hr k Total Skin
2
Mscf/d psia /cp/log cycle mD
40×10 3 16.64×10 6 828.38×10 6 45 9.9
60 " 26.08 " 645.16 " 43 11.9
TABLE 8.13
The values of the permeability in this table have been calculated using equ. (8.54) for
rates Q 1 and Q 2 and the total skin factors using equs. (8.57) and (8.60) for the first and
second flow periods respectively. In applying equ. (8.60) the value of ( ) 1hr has
mp′
ws
−
2
6
been determined from the buildup plot for ∆t = 9 hours as 1064.65 × 10 psia /cp
(fig. 8.15 (a) and table 8.12). The reader can verify that irrespective of whether
( )
mp
mp′ ( ) for the maximum buildup time, or m(p i) is used in equ. (8.60) makes
ws
1hr, ws
−
very little difference to the calculated value of S′ . Finally, S and D can be calculated by
2
solving the equations
S′ 1 = 9.9 = S + 40 × 10 3 D
S′ 2 = 11.9 = S + 60 × 10 3 D
-4
to give S = 5.9; D = 1.0 × 10 /Mscf/d
1422 DT
2
and F = = 0.043 psia /cp/(Mscf/d) 2
kh
and from these figures the Darcy flow coefficient B can be calculated for the estimated
values of A and C A, equ. (8.44), for use in long term well deliverability calculations.
A similar example of a pressure buildup analysis, for a low permeability reservoir
3
(k = 5 mD),has been presented in the literature by Al-Hussainy and Ramey . The main
advantage of this type of test over the multi-rate drawdown test is the same as
mentioned in Chapter 7, sec. 7. It is, that the buildup analysis will provide values of
k and S′ which are independent of the value of m(t D ) at the time of the survey.
1
Furthermore, since only the transient pressure response during each flow period is
interpreted, then it means that the entire test can be analysed without having to be
concerned about the size or shape of the area drained or the well position with respect
to the boundary.
The pressure buildup test can also be used for the routine surveys conducted at
regular intervals throughout the producing life of the field. Prior to the survey the well
must be produced at a constant rate for a sufficient period of time so that the flow is
under semi-steady state conditions. This renders transient analysis of the first flow
period, at rate Q 1, impossible but analysis of the buildup will yield values of k and S′.
1
Following this, k and S′ can be determined from the transient analysis of the second
2