
Page 348 - Fundamentals of Reservoir Engineering
P. 348
REAL GAS FLOW: GAS WELL TESTING 283
2) From the flow tests determine k, S′, S′ and hence D, or F.
2
1
EXERCISE 8.3 SOLUTION
1) Buildup Analysis
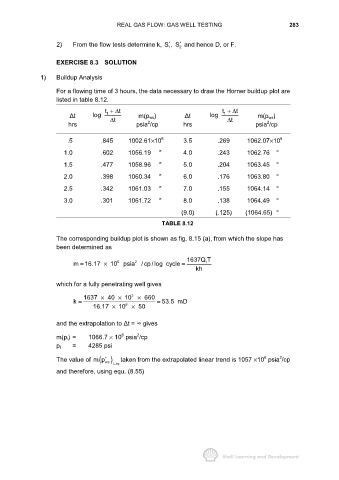
For a flowing time of 3 hours, the data necessary to draw the Horner buildup plot are
listed in table 8.12.
t +∆ t t +∆ t
1
1
∆t log m(p ws) ∆t log m(p ws)
2
2
hrs t ∆ psia /cp hrs t ∆ psia /cp
.5 .845 1002.61×10 6 3.5 .269 1062.07×10 6
1.0 .602 1056.19 " 4.0 .243 1062.76 "
1.5 .477 1058.96 " 5.0 .204 1063.45 "
2.0 .398 1060.34 " 6.0 .176 1063.80 "
2.5 .342 1061.03 " 7.0 .155 1064.14 "
3.0 .301 1061.72 " 8.0 .138 1064.49 "
(9.0) (.125) (1064.65) "
TABLE 8.12
The corresponding buildup plot is shown as fig. 8.15 (a), from which the slope has
been determined as
1637Q T
2
6
m 16.17 × 10 psia / cp /log cycle = 1
=
kh
which for a fully penetrating well gives
3
1637 × 40 × 10 × 660
k = 6 = 53.5 mD
16.17 × 10 × 50
and the extrapolation to ∆t = ∞ gives
2
6
m(p i) = 1066.7 × 10 psia /cp
p i = 4285 psi
6
2
The value of ( ) 1hr taken from the extrapolated linear trend is 1057 ×10 psia /cp
mp′
ws
−
and therefore, using equ. (8.55)