
Page 259 - Fundamentals of Water Treatment Unit Processes : Physical, Chemical, and Biological
P. 259
214 Fundamentals of Water Treatment Unit Processes: Physical, Chemical, and Biological
Discussion 9.7.3.1 Typical Zeta Potentials
The factor 12.9, rounded to 13, is an accepted empirical Figure 9.15 is a bar chart showing zeta potentials for 11
conversion factor to convert EM (mm=s=V=cm) to z (mV).
organisms measured at pH ¼ 7.0. Algae sizes ranged 2–70
mm, with shapes spherical, oval, rod, needle, oval with spines,
9.7.3 MEASURED ZETA POTENTIALS etc. An important point is that zeta potentials varied between
organisms. The log removals by filtration were found to
In general, and as indicated in Table 9.1, zeta potentials of
increase with increasingly negative zeta potentials, for
most kinds of particles are negative, varying from 3to 50
example, log R(chorella) 2.0 with 3.0 log R 3.5 for the
mV. In addition to variation between particle categories,
other organisms (Hendricks et al., 2000, p. 130, 2005, p. 1628).
however, zeta potentials are affected by pH, alum dosage,
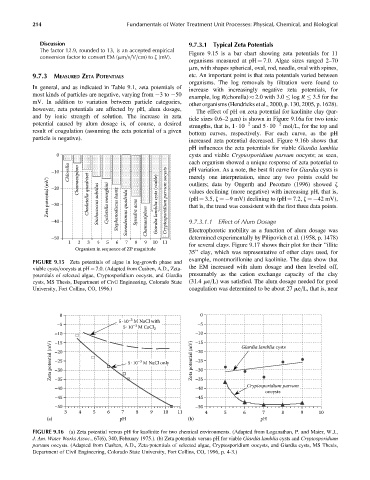
The effect of pH on zeta potential for kaolinite clay (par-
and by ionic strength of solution. The increase in zeta
ticle sizes 0.6–2 mm) is shown in Figure 9.16a for two ionic
potential caused by alum dosage is, of course, a desired 2 2
strengths, that is, 1 10 and 5 10 mol=L, for the top and
result of coagulation (assuming the zeta potential of a given
bottom curves, respectively. For each curve, as the pH
particle is negative).
increased zeta potential decreased. Figure 9.16b shows that
pH influences the zeta potentials for viable Giardia lamblia
0 cysts and viable Cryptosporidium parvum oocysts; as seen,
each organism showed a unique response of zeta potential to
Chlorella Chamaesiphon merely one interpretation, since any two points could be
–10 pH variation. As a note, the best fit curve for Giardia cysts is
Zeta potential (mV) –20 Chodatella quadriset Stichococcus subtilus Cyclotella meneghini Giardia lamblia cysts (viable) Cryptosporidium parvum oocysts values declining (more negative) with increasing pH, that is,
outliers; data by Ongerth and Pecoraro (1996) showed z
(pH ¼ 3.5, z ¼ 9 mV) declining to (pH ¼ 7.2, z ¼ 42 mV),
–30
that is, the trend was consistent with the first three data points.
–40 Stephanodiscus hantz Scenedesmus quadrida Synedra acus Chamaesiphon 9.7.3.1.1 Effect of Alum Dosage
determined experimentally by Pilipovich et al. (1958, p. 1478)
–50 Electrophoretic mobility as a function of alum dosage was
1 2 3 4 5 6 7 8 9 10 11
for several clays. Figure 9.17 shows their plot for their ‘‘illite
Organism in sequence of ZP magnitude
35’’ clay, which was representative of other clays used, for
example, montmorillonite and kaolinite. The data show that
FIGURE 9.15 Zeta potentials of algae in log-growth phase and
viable cysts=oocysts at pH ¼ 7.0. (Adapted from Cushen, A.D., Zeta- the EM increased with alum dosage and then leveled off,
potentials of selected algae, Cryptosporidium oocysts, and Giardia presumably as the cation exchange capacity of the clay
cysts, MS Thesis, Department of Civil Engineering, Colorado State (31.4 me=L) was satisfied. The alum dosage needed for good
University, Fort Collins, CO, 1996.) coagulation was determined to be about 27 me=L, that is, near
0 0
–3
5·10 M NaCl with
–5 –3 –5
5·10 M CaCl 2
–10 –10 Giardia lamblia cysts
–15
–15
Zeta potential (mV) –20 5·10 M NaCl only Zeta potential (mV) –20
–25
–25
–3
–30
–30
–35
–35
Cryptosporidium parvum
–40 –40
oocysts
–45 –45
–50 –50
3 4 5 6 7 8 9 10 11 4 5 6 7 8 9 10
(a) pH (b) pH
FIGURE 9.16 (a) Zeta potential versus pH for kaolinite for two chemical environments. (Adapted from Loganathan, P. and Maier, W.J.,
J. Am. Water Works Assoc., 67(6), 340, February 1975.). (b) Zeta potentials versus pH for viable Giardia lamblia cysts and Cryptosporidium
parvum oocysts. (Adapted from Cushen, A.D., Zeta-potentials of selected algae, Cryptosporidium oocysts, and Giardia cysts, MS Thesis,
Department of Civil Engineering, Colorado State University, Fort Collins, CO, 1996, p. 4-3.)