
Page 261 - Fundamentals of Water Treatment Unit Processes : Physical, Chemical, and Biological
P. 261
216 Fundamentals of Water Treatment Unit Processes: Physical, Chemical, and Biological
6
Turbidity (NTU) 4 2 Effluent turbidity
0
Alum dosage
5 mg/L 10 mg/L 15 mg/L 20 mg/L Start optimum alum
dose 26 mg/L
–2
–4
SCD Streaming current detector
–6
–8
0 10 20 30 40 50 60 70 80 90 100 110 120 130 140 150
Time (min)
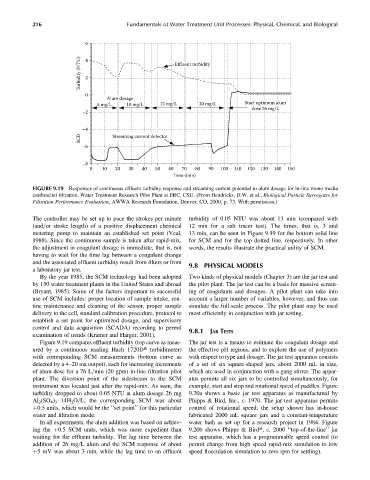
FIGURE 9.19 Responses of continuous effluent turbidity response and streaming current potential to alum dosage for in-line mono media
(anthracite) filtration, Water Treatment Research Pilot Plant at ERC, CSU. (From Hendricks, D.W. et al., Biological Particle Surrogates for
Filtration Performance Evaluation, AWWA Research Foundation, Denver, CO, 2000, p. 73. With permission.)
The controller may be set up to pace the strokes per minute turbidity of 0.05 NTU was about 13 min (compared with
(and=or stroke length) of a positive displacement chemical 12 min for a salt tracer test). The times, that is, 3 and
metering pump to maintain an established set point (Veal, 13 min, can be seen in Figure 9.19 for the bottom solid line
1988). Since the continuous sample is taken after rapid-mix, for SCM and for the top dotted line, respectively. In other
the adjustment in coagulant dosage is immediate, that is, not words, the results illustrate the practical utility of SCM.
having to wait for the time lag between a coagulant change
and the associated effluent turbidity result from filters or from 9.8 PHYSICAL MODELS
a laboratory jar test.
By the year 1985, the SCM technology had been adopted Two kinds of physical models (Chapter 3) are the jar test and
by 150 water treatment plants in the United States and abroad the pilot plant. The jar test can be a basis for massive screen-
(Bryant, 1985). Some of the factors important to successful ing of coagulants and dosages. A pilot plant can take into
use of SCM includes: proper location of sample intake, rou- account a larger number of variables, however, and thus can
tine maintenance and cleaning of the sensor, proper sample simulate the full-scale process. The pilot plant may be used
delivery to the cell, standard calibration procedure, protocol to most efficiently in conjunction with jar testing.
establish a set point for optimized dosage, and supervisory
control and data acquisition (SCADA) recording to permit
9.8.1 JAR TESTS
examination of trends (Kramer and Harger, 2001).
Figure 9.19 compares effluent turbidity (top curve as meas- The jar test is a means to estimate the coagulant dosage and
ured by a continuous reading Hach 1720Dt turbidimeter) the effective pH regions, and to explore the use of polymers
with corresponding SCM measurements (bottom curve as with respect to type and dosage. The jar test apparatus consists
detected by a 4–20 ma output), each for increasing increments of a set of six square-shaped jars, about 2000 mL in size,
of alum dose for a 76 L=min (20 gpm) in-line filtration pilot which are used in conjunction with a gang stirrer. The appar-
plant. The diversion point of the sidestream to the SCM atus permits all six jars to be controlled simultaneously, for
instrument was located just after the rapid-mix. As seen, the example, start and stop and rotational speed of paddles. Figure
turbidity dropped to about 0.05 NTU at alum dosage 26 mg 9.20a shows a basic jar test apparatus as manufactured by
Al 2 (SO 4 ) 3 14H 2 O=L; the corresponding SCM was about Phipps & Bird, Inc., c. 1970. The jar test apparatus permits
þ0.5 units, which would be the ‘‘set point’’ for this particular control of rotational speed; the setup shown has in-house
water and filtration mode. fabricated 2000 mL square jars and a constant-temperature
In all experiments, the alum addition was based on achiev- water bath as set up for a research project in 1984. Figure
ing the þ0.5 SCM units, which was more expedient than 9.20b shows Phipps & Birdt, c. 2000 ‘‘top-of-the-line’’ jar
waiting for the effluent turbidity. The lag time between the test apparatus, which has a programmable speed control (to
addition of 26 mg=L alum and the SCM response of about permit change from high speed rapid-mix simulation to low
þ5 mV was about 3 min, while the lag time to an effluent speed flocculation simulation to zero rpm for settling).