
Page 506 - Fundamentals of Water Treatment Unit Processes : Physical, Chemical, and Biological
P. 506
Adsorption 461
Figure 15.1 is a sketch depicting schematically the internal
Macropore
structureofactivatedcarbonpores.Someofthemacroporesopen
directly to the external surface of the GAC particle, while the
transitionalporesconnectthemacroporesandthemicropores.As
indicated in the sketch, the small molecules have access to the
micropores while the larger molecules may gain entrance only to
Transitional the transitional pores. Thus, the capacity of the GAC for the large
pore molecules is not as high as for the small molecules (on a moles
adsorbate per gram of GAC basis). In terms of surface area, the
Micropore micropores provide about 0.9 of the total.
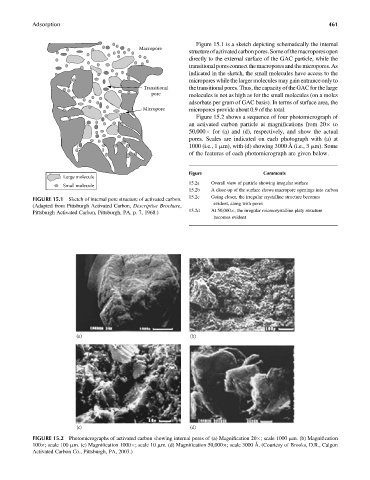
Figure 15.2 shows a sequence of four photomicrograph of
an activated carbon particle at magnifications from 20 to
50,000 for (a) and (d), respectively, and show the actual
pores. Scales are indicated on each photograph with (a) at
1000 (i.e., 1 mm), with (d) showing 3000 Å (i.e., 3 mm). Some
of the features of each photomicrograph are given below.
Figure Comments
Large molecule
15.2a Overall view of particle showing irregular surface
Small molecule
15.2b A close-up of the surface shows macropore openings into carbon
FIGURE 15.1 Sketch of internal pore structure of activated carbon. 15.2c Going closer, the irregular crystalline structure becomes
evident, along with pores
(Adapted from Pittsburgh Activated Carbon, Descriptive Brochure,
15.2d At 50,000 , the irregular microcrystalline platy structure
Pittsburgh Activated Carbon, Pittsburgh, PA, p. 7, 1968.)
becomes evident
(a) (b)
(c) (d)
FIGURE 15.2 Photomicrographs of activated carbon showing internal pores of (a) Magnification 20 ; scale 1000 mm. (b) Magnification
100 ; scale 100 mm. (c) Magnification 1000 ; scale 10 mm. (d) Magnification 50,000 ; scale 3000 Å. (Courtesy of Brooks, D.R., Calgon
Activated Carbon Co., Pittsburgh, PA, 2003.)