
Page 507 - Fundamentals of Water Treatment Unit Processes : Physical, Chemical, and Biological
P. 507
462 Fundamentals of Water Treatment Unit Processes: Physical, Chemical, and Biological
12 70
Filtrasorb 400 60 Filtrasorb 200
Pressure drop (kPa/m bed depth) 8 6 4 Filtrasorb 300 Expansion of carbon bed (%) 40 Filtrasorb 400 Filtrasorb 300
10
Filtrasorb 200
50
Filtrasorb 100
Filtrasorb 100
30
20
0 2 10 0
0 5 10 15 20 25 0 10 20 30 40 50
(a) Backwash velocity (m/h) (b) Backwash velocity (m/h)
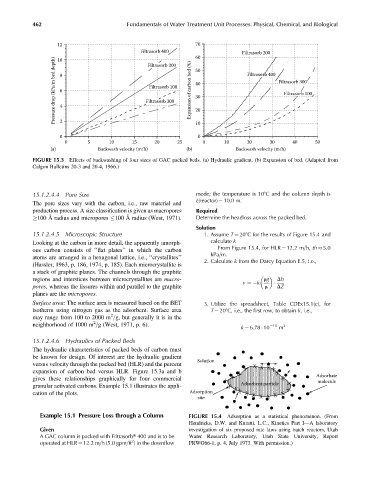
FIGURE 15.3 Effects of backwashing of four sizes of GAC packed beds. (a) Hydraulic gradient. (b) Expansion of bed. (Adapted from
Calgon Bulletins 20-3 and 20-4, 1966.)
15.1.2.4.4 Pore Size mode; the temperature is 108C and the column depth is
L(reactor) ¼ 10.0 m.
The pore sizes vary with the carbon, i.e., raw material and
production process. A size classification is given as macropores Required
100 Å radius and micropores 100 Å radius (West, 1971). Determine the headloss across the packed bed.
Solution
15.1.2.4.5 Microscopic Structure 1. Assume T ¼ 208C for the results of Figure 15.4 and
Looking at the carbon in more detail, the apparently amorph- calculate k
From Figure 15.4, for HLR ¼ 12.2 m=h, th 5.0
ous carbon consists of ‘‘flat plates’’ in which the carbon
kPa=m.
atoms are arranged in a hexagonal lattice, i.e., ‘‘crystallites’’
2. Calculate k from the Darcy Equation E.5, i.e.,
(Hassler, 1963, p. 186, 1974, p. 185). Each microcrystallite is
a stack of graphite planes. The channels through the graphite
regions and interstices between microcrystallites are macro- rg Dh
v ¼ k
pores, whereas the fissures within and parallel to the graphite m DZ
planes are the micropores.
Surface area: The surface area is measured based on the BET 3. Utilize the spreadsheet, Table CDEx15.1(c), for
isotherm using nitrogen gas as the adsorbent. Surface area T ¼ 208C, i.e., the first row, to obtain k, i.e.,
2
may range from 100 to 2000 m =g, but generally it is in the
2
neighborhood of 1000 m =g (West, 1971, p. 6). 10 2
k ¼ 6.78 10 m
15.1.2.4.6 Hydraulics of Packed Beds
The hydraulic characteristics of packed beds of carbon must
be known for design. Of interest are the hydraulic gradient
Solution
versus velocity through the packed bed (HLR) and the percent X X X
expansion of carbon bed versus HLR. Figure 15.3a and b X X X X X
gives these relationships graphically for four commercial X X Adsorbate
molecule
granular activated carbons. Example 15.1 illustrates the appli- X Adsorbent particle X X
cation of the plots. Adsorption X X X X X
site X XX
Example 15.1 Pressure Loss through a Column FIGURE 15.4 Adsorption as a statistical phenomenon. (From
Hendricks, D.W. and Kuratti, L.C., Kinetics Part I—A laboratory
Given investigation of six proposed rate laws using batch reactors, Utah
A GAC column is packed with Filtrasorbt 400 and is to be Water Research Laboratory, Utah State University, Report
2
operated at HLR ¼ 12.2 m=h (5.0 gpm=ft ) in the downflow PRWG66-1, p. 4, July 1973. With permission.)