
Page 511 - Fundamentals of Water Treatment Unit Processes : Physical, Chemical, and Biological
P. 511
466 Fundamentals of Water Treatment Unit Processes: Physical, Chemical, and Biological
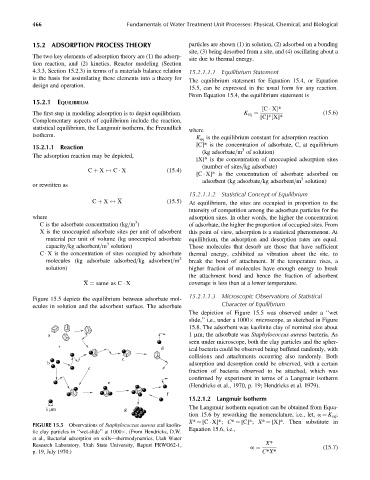
15.2 ADSORPTION PROCESS THEORY particles are shown (1) in solution, (2) adsorbed on a bonding
site, (3) being desorbed from a site, and (4) oscillating about a
The two key elements of adsorption theory are (1) the adsorp-
site due to thermal energy.
tion reaction, and (2) kinetics. Reactor modeling (Section
4.3.3, Section 15.2.3) in terms of a materials balance relation 15.2.1.1.1 Equilibrium Statement
is the basis for assimilating these elements into a theory for
The equilibrium statement for Equation 15.4, or Equation
design and operation. 15.5, can be expressed in the usual form for any reaction.
From Equation 15.4, the equilibrium statement is
15.2.1 EQUILIBRIUM
[C X]*
The first step in modeling adsorption is to depict equilibrium. K eq ¼ (15:6)
[C]*[X]*
Complementary aspects of equilibrium include the reaction,
statistical equilibrium, the Langmuir isotherm, the Freundlich
where
isotherm.
K eq is the equilibrium constant for adsorption reaction
[C]* is the concentration of adsorbate, C, at equilibrium
15.2.1.1 Reaction 3
(kg adsorbate=m of solution)
The adsorption reaction may be depicted,
[X]* is the concentration of unoccupied adsorption sites
(number of sites=kg adsorbate)
C þ X $ C X (15:4)
[C X]* is the concentration of adsorbate adsorbed on
3
adsorbent (kg adsorbate=kg adsorbent=m solution)
or rewritten as
15.2.1.1.2 Statistical Concept of Equilibrium
C þ X $ X (15:5) At equilibrium, the sites are occupied in proportion to the
intensity of competition among the adsorbate particles for the
where adsorption sites. In other words, the higher the concentration
3
C is the adsorbate concentration (kg=m ) of adsorbate, the higher the proportion of occupied sites. From
X is the unoccupied adsorbate sites per unit of adsorbent this point of view, adsorption is a statistical phenomenon. At
material per unit of volume (kg unoccupied adsorbate equilibrium, the adsorption and desorption rates are equal.
3
capacity=kg adsorbent=m solution) Those molecules that desorb are those that have sufficient
C X is the concentration of sites occupied by adsorbate thermal energy, exhibited as vibration about the site, to
3
molecules (kg adsorbate adsorbed=kg adsorbent=m break the bond of attachment. If the temperature rises, a
solution) higher fraction of molecules have enough energy to break
the attachment bond and hence the fraction of adsorbent
X ¼ same as C X coverage is less than at a lower temperature.
15.2.1.1.3 Microscopic Observations of Statistical
Figure 15.5 depicts the equilibrium between adsorbate mol-
ecules in solution and the adsorbent surface. The adsorbate Character of Equilibrium
The depiction of Figure 15.5 was observed under a ‘‘wet
slide,’’ i.e., under a 1000 microscope, as sketched in Figure
15.8. The adsorbent was kaolinite clay of nominal size about
a 1 mm; the adsorbate was Staphylococcus aureus bacteria. As
seen under microscope, both the clay particles and the spher-
+ d ical bacteria could be observed being buffeted randomly, with
collisions and attachments occurring also randomly. Both
c
b adsorption and desorption could be observed, with a certain
c
fraction of bacteria observed to be attached, which was
confirmed by experiment in terms of a Langmuir isotherm
e
(Hendricks et al., 1970, p. 19; Hendricks et al. 1979).
f
15.2.1.2 Langmuir Isotherm
1 μm g The Langmuir isotherm equation can be obtained from Equa-
tion 15.6 by reworking the nomenclature, i.e., let, a ¼ K eq ;
X* ¼ [C X]*; C* ¼ [C]*; X* ¼ [X]*. Then substitute in
FIGURE 15.5 Observations of Staphylococcus aureus and kaolin-
Equation 15.6, i.e.,
ite clay particles in ‘‘wet-slide’’ at 1000 . (From Hendricks, D.W.
et al., Bacterial adsorption on soils—thermodynamics, Utah Water
X*
Research Laboratory, Utah State University, Report PRWG62-1,
a ¼ (15:7)
p. 19, July 1970.) C*X*