
Page 513 - Fundamentals of Water Treatment Unit Processes : Physical, Chemical, and Biological
P. 513
468 Fundamentals of Water Treatment Unit Processes: Physical, Chemical, and Biological
measurements, an easily measurable concentration of adsorb- Discussion
ate was the main concern. The isotherm of Figure 15.6 was defined by 28 equilibrium
The adsorbate depletion curve and the associated adsorbent points; each point was determined by an adsorbate deple-
tion curve and a calculated uptake curve such as illus-
uptake curves are described by the equations,
trated for Run #7. A more common method of determining
an isotherm is to pulverize the adsorbate and to use a
(C 0 C)=C 0 ¼ 10 ( k C =2:3) t (15:13)
^
smaller flask and a water bath with a shaker mechanism.
(X* X)=X* ¼ 10 ( k X =2:3) t (15:14)
^
Example 15.4 Analysis of Adsorption Uptake Data
In logarithmic form the two equations are to Determine Kinetic Coefficients
log (C 0 C) ¼ log C 0 (k C =2:3) t (15:15) Given
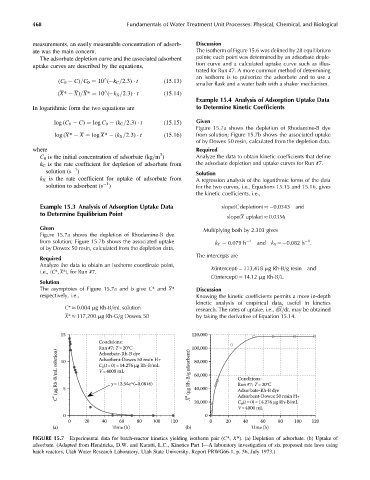
Figure 15.7a shows the depletion of Rhodamine-B dye
log (X* X ¼ log X* (k X =2:3) t (15:16) from solution; Figure 15.7b shows the associated uptake
of by Dowex 50 resin, calculated from the depletion data.
where Required
3
C 0 is the initial concentration of adsorbate (kg=m ) Analyze the data to obtain kinetic coefficients that define
k C is the rate coefficient for depletion of adsorbate from the adsorbate depletion and uptake curves for Run #7.
1
solution (s ) Solution
k X is the rate coefficient for uptake of adsorbate from A regression analysis of the logarithmic forms of the data
1
solution to adsorbent (s ) for the two curves, i.e., Equations 15.15 and 15.16, gives
the kinetic coefficients, i.e.,
Example 15.3 Analysis of Adsorption Uptake Data slope(C depletion) 0.0343 and
to Determine Equilibrium Point
slope(X uptake) 0.0356
Given Multiplying both by 2.303 gives
Figure 15.7a shows the depletion of Rhodamine-B dye
1
from solution; Figure 15.7b shows the associated uptake k C 0.079 h 1 and k X ¼ 0.082 h .
of by Dowex 50 resin, calculated from the depletion data.
The intercepts are
Required
Analyze the data to obtain an isotherm coordinate point, X(intercept) ¼ 113,418 mg Rh-B=g resin and
i.e., (C*, X*), for Run #7.
C(intercept) ¼ 14.12 mg Rh-B=L.
Solution
The asymptotes of Figure 15.7a and b give C* and X* Discussion
respectively, i.e., Knowing the kinetic coefficients permits a more in-depth
kinetic analysis of empirical data, useful in kinetics
C* 0.004 mg Rh-B=mL solution
research. The rates of uptake, i.e., dX=dt, may be obtained
X* 117,200 mg Rh-G=g Dowex 50 by taking the derivative of Equation 15.14.
15 120,000
Conditions:
Run #7; T= 20°C 100,000
C * (μg Rh-B/mL solution) 10 5 C (t = 0)=14.276 μg Rh-B/mL – * (μg Rh-B/g adsorbent) 80,000 Conditions:
Adsorbate-Rh-B dye
Adsorbent-Dowex 50 resin H+
0
V= 4000 mL
60,000
y = 13.54e^(–0.0816)
Run #7; T=20°C
40,000
Adsorbent-Dowex 50 resin H+
X
C (t =0)= 14.276 μg Rh-B/mL
20,000 Adsorbate-Rh-B dye
0
V=4000 mL
0 0
0 20 40 60 80 100 120 0 20 40 60 80 100 120
(a) Time (h) (b) Time (h)
FIGURE 15.7 Experimental data for batch-reactor kinetics yielding isotherm pair (C*, X*). (a) Depletion of adsorbate. (b) Uptake of
adsorbate. (Adapted from Hendricks, D.W. and Kuratti, L.C., Kinetics Part I—A laboratory investigation of six proposed rate laws using
batch reactors, Utah Water Research Laboratory, Utah State University, Report PRWG66-1, p. 56, July 1973.)