
Page 516 - Fundamentals of Water Treatment Unit Processes : Physical, Chemical, and Biological
P. 516
Adsorption 471
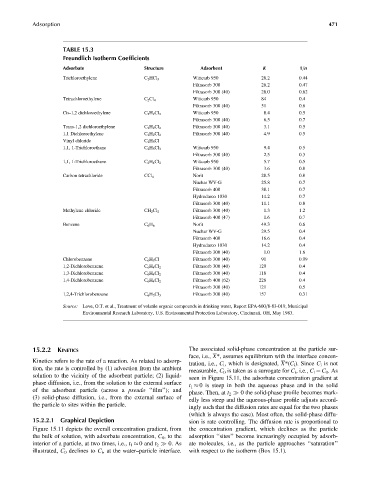
TABLE 15.3
Freundlich Isotherm Coefficients
Adsorbate Structure Adsorbent K 1=n
Trichloroethylene C 2 HCl 3 Wittcarb 950 28.2 0.44
Filtrasorb 300 26.2 0.47
Filtrasorb 300 (40) 28.0 0.62
Tetrachloroethylene C 2 Cl 4 Wittcarb 950 84 0.4
Filtrasorb 300 (40) 51 0.6
Cis-1,2 dichloroethylene C 2 H 2 Cl 2 Wittcarb 950 8.4 0.5
Filtrasorb 300 (40) 6.5 0.7
Trans-1,2 dichloroethylene C 2 H 2 Cl 2 Filtrasorb 300 (40) 3.1 0.5
1,1 Dichloroethylene C 2 H 2 Cl 2 Filtrasorb 300 (40) 4.9 0.5
Vinyl chloride C 2 H 3 Cl
1,1, 1-Trichloroethane C 2 H 3 Cl 3 Wittcarb 950 9.4 0.5
Filtrasorb 300 (40) 2.5 0.3
1,1, 1-Trichloroethane C 2 H 4 Cl 2 Wittcarb 950 5.7 0.5
Filtrasorb 300 (40) 3.6 0.8
Carbon tetrachloride CCl 4 Norit 28.5 0.8
Nuchar WV-G 25.8 0.7
Filtrasorb 400 38.1 0.7
Hydrodarco 1030 14.2 0.7
Filtrasorb 300 (40) 11.1 0.8
Methylene chloride CH 2 Cl 2 Filtrasorb 300 (40) 1.3 1.2
Filtrasorb 400 (47) 1.6 0.7
Benzene C 6 H 6 Norit 49.3 0.6
Nuchar WV-G 29.5 0.4
Filtrasorb 400 16.6 0.4
Hydrodarco 1030 14.2 0.4
Filtrasorb 300 (40) 1.0 1.6
Chlorobenzene C 6 H 5 Cl Filtrasorb 300 (40) 91 0.99
1,2-Dichlorobenzene C 6 H 4 Cl 2 Filtrasorb 300 (40) 129 0.4
1,3-Dichlorobenzene C 6 H 4 Cl 2 Filtrasorb 300 (40) 118 0.4
1,4-Dichlorobenzene C 6 H 4 Cl 2 Filtrasorb 400 (62) 226 0.4
Filtrasorb 300 (40) 121 0.5
1,2,4-Trichlorobenzene C 6 H 3 Cl 3 Filtrasorb 300 (40) 157 0.31
Source: Love, O.T. et al., Treatment of volatile organic compounds in drinking water, Report EPA-600=8-83-019, Municipal
Environmental Research Laboratory, U.S. Environmental Protection Laboratory, Cincinnati, OH, May 1983.
15.2.2 KINETICS The associated solid-phase concentration at the particle sur-
face, i.e., X*, assumes equilibrium with the interface concen-
Kinetics refers to the rate of a reaction. As related to adsorp-
tration, i.e., C i , which is designated, X*(C i ). Since C i is not
tion, the rate is controlled by (1) advection from the ambient
measurable, C 0 is taken as a surrogate for C i , i.e., C i ¼ C 0 .As
solution to the vicinity of the adsorbent particle; (2) liquid-
seen in Figure 15.11, the adsorbate concentration gradient at
phase diffusion, i.e., from the solution to the external surface
t 1 0 is steep in both the aqueous phase and in the solid
of the adsorbent particle (across a pseudo ‘‘film’’); and
phase. Then, at t 2 0 the solid-phase profile becomes mark-
(3) solid-phase diffusion, i.e., from the external surface of
edly less steep and the aqueous-phase profile adjusts accord-
the particle to sites within the particle.
ingly such that the diffusion rates are equal for the two phases
(which is always the case). Most often, the solid-phase diffu-
15.2.2.1 Graphical Depiction sion is rate controlling. The diffusion rate is proportional to
Figure 15.11 depicts the overall concentration gradient, from the concentration gradient, which declines as the particle
the bulk of solution, with adsorbate concentration, C 0 , to the adsorption ‘‘sites’’ become increasingly occupied by adsorb-
interior of a particle, at two times, i.e., t 1 0 and t 2 0. As ate molecules, i.e., as the particle approaches ‘‘saturation’’
illustrated, C 0 declines to C i , at the water–particle interface. with respect to the isotherm (Box 15.1).