
Page 515 - Fundamentals of Water Treatment Unit Processes : Physical, Chemical, and Biological
P. 515
470 Fundamentals of Water Treatment Unit Processes: Physical, Chemical, and Biological
120 100
100 A 10
X* (mg sorbate/g sorbent) 60 Data limits B C X* (mg sorbate/g sorbent) C
80
– 40 K 1/n – 1 B A
20 A-Filtrasorb 300 (40) 28.0 0.62
B-Filtrasorb 300 26.2 0.47
C-Witcarb 950 28.2 0.44
0 0.1
0 2 4 6 8 10 0.001 0.01 0.1 1 10
(a) C* (mg/L) (b) C* (mg/L)
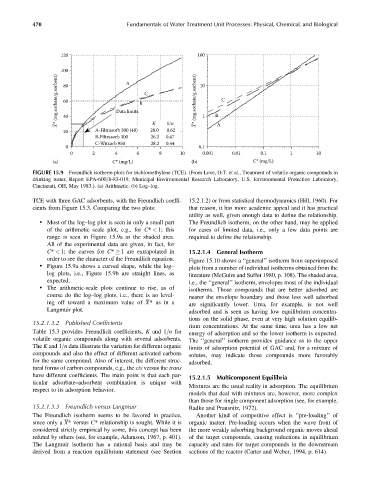
FIGURE 15.9 Freundlich isotherm plots for trichloroethylene (TCE). (From Love, O.T. et al., Treatment of volatile organic compounds in
drinking water, Report EPA-600=8-83-019, Municipal Environmental Research Laboratory, U.S. Environmental Protection Laboratory,
Cincinnati, OH, May 1983.). (a) Arithmetic. (b) Log–log.
TCE with three GAC adsorbents, with the Freundlich coeffi- 15.2.1.2) or from statistical thermodynamics (Hill, 1960). For
cients from Figure 15.3. Comparing the two plots: that reason, it has more academic appeal and it has practical
utility as well, given enough data to define the relationship.
. Most of the log–log plot is seen in only a small part The Freundlich isotherm, on the other hand, may be applied
of the arithmetic scale plot, e.g., for C* < 1; this for cases of limited data, i.e., only a few data points are
range is seen in Figure 15.9a as the shaded area. required to define the relationship.
All of the experimental data are given, in fact, for
C* < 1; the curves for C* 1 are extrapolated in 15.2.1.4 General Isotherm
order to see the character of the Freundlich equation. Figure 15.10 shows a ‘‘general’’ isotherm from superimposed
. Figure 15.9a shows a curved shape, while the log– plots from a number of individual isotherms obtained from the
log plots, i.e., Figure 15.9b are straight lines, as literature (McGuire and Suffet 1980, p. 108). The shaded area,
expected. i.e., the ‘‘general’’ isotherm, envelopes most of the individual
. The arithmetic-scale plots continue to rise, as of
isotherms. Those compounds that are better adsorbed are
course do the log–log plots, i.e., there is no level- nearer the envelope boundary and those less well adsorbed
ing off toward a maximum value of X*as ina are significantly lower. Urea, for example, is not well
Langmuir plot. adsorbed and is seen as having low equilibrium concentra-
tions on the solid phase, even at very high solution equilib-
15.2.1.3.2 Published Coefficients
rium concentrations. At the same time, urea has a low net
Table 15.3 provides Freundlich coefficients, K and 1=n for energy of adsorption and so the lower isotherm is expected.
volatile organic compounds along with several adsorbents. The ‘‘general’’ isotherm provides guidance as to the upper
The K and 1=n data illustrate the variation for different organic limits of adsorption potential of GAC and, for a mixture of
compounds and also the effect of different activated carbons solutes, may indicate those compounds more favorably
for the same compound. Also of interest, the different struc- adsorbed.
tural forms of carbon compounds, e.g., the cis versus the trans
have different coefficients. The main point is that each par- 15.2.1.5 Multicomponent Equilibria
ticular adsorbate–adsorbent combination is unique with
Mixtures are the usual reality in adsorption. The equilibrium
respect to its adsorption behavior.
models that deal with mixtures are, however, more complex
than those for single component adsorption (see, for example,
15.2.1.3.3 Freundlich versus Langmuir Radke and Prausnitz, 1972).
The Freundlich isotherm seems to be favored in practice, Another kind of competitive effect is ‘‘pre-loading’’ of
since only a X* versus C* relationship is sought. While it is organic matter. Pre-loading occurs when the wave front of
considered strictly empirical by some, this concept has been the more weakly adsorbing background organic moves ahead
refuted by others (see, for example, Adamson, 1967, p. 401). of the target compounds, causing reductions in equilibrium
The Langmuir isotherm has a rational basis and may be capacity and rates for target compounds in the downstream
derived from a reaction equilibrium statement (see Section sections of the reactor (Carter and Weber, 1994, p. 614).