
Page 514 - Fundamentals of Water Treatment Unit Processes : Physical, Chemical, and Biological
P. 514
Adsorption 469
15.2.1.2.4 Thermodynamics values, with the latter appearing in the effluent of a GAC
The effect of temperature on adsorption equilibrium is given column, i.e., as a chromatographic effect (McGuire and
by the van’t Hoff equation (Alberty and Silbey, 1992, p. 160), Suffet, 1980, p. 102).
a ¼ C vh e DH =RT (15:17)
15.2.1.3 Freundlich Isotherm
The Freundlich isotherm is used commonly, i.e., used more
or, in terms of base 10 exponent,
frequently than the Langmuir, to describe adsorbate–adsorbent
equilibrium (see, for example, Snoeyink et al., 1969, Culp
DH =2:3RT
a ¼ C vh 10 (15:18)
et al., 1978, p. 178) and is given,
where 1=n
DH8 is the standard state enthalpy of reaction (kilocalories X* ¼ KC* (15:19)
per mole),
R is the gas constant (1.98 kcal per mole per degree), where
T A is the temperature (K). The temperature symbol is used, K is the coefficient unique to a particular adsorbate–
nearly always, in conjunction with units; thus in T (K) adsorbent equilibrium
means temperature in Kelvin, which is synonymous n is the exponent unique to a particular adsorbate–adsorbent
with absolute temperature. T (8C) means temperature in equilibrium
degree Celsius.
C vh is the constant, dimensionless The logarithmic form is
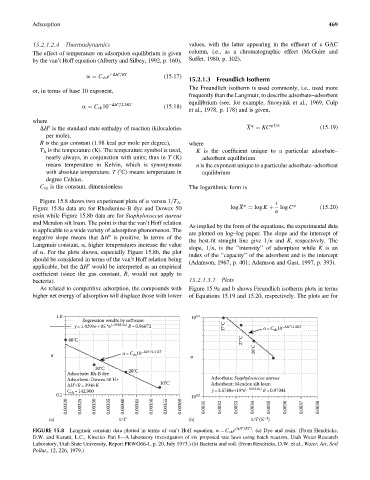
Figure 15.8 shows two experiment plots of a versus 1=T A . i
Figure 15.8a data are for Rhodamine-B dye and Dowex 50 log X* ¼ log K þ log C* (15:20)
n
resin while Figure 15.8b data are for Staphylococcus aureus
and Mendon silt loam. The point is that the van’t Hoff relation
As implied by the form of the equations, the experimental data
is applicable to a wide variety of adsorption phenomenon. The
are plotted on log–log paper. The slope and the intercept of
negative slope means that DH8 is positive. In terms of the
the best-fit straight line give 1=n and K, respectively. The
Langmuir constant, a, higher temperatures increase the value
slope, 1=n, is the ‘‘intensity’’ of adsorption while K is an
of a. For the plots shown, especially Figure 15.8b, the plot
index of the ‘‘capacity’’ of the adsorbent and is the intercept
should be considered in terms of the van’t Hoff relation being
(Adamson, 1967, p. 401; Adamson and Gast, 1997, p. 393).
applicable, but the DH8 would be interpreted as an empirical
coefficient (since the gas constant, R, would not apply to
bacteria). 15.2.1.3.1 Plots
As related to competitive adsorption, the compounds with Figure 15.9a and b shows Freundlich isotherm plots in terms
higher net energy of adsorption will displace those with lower of Equations 15.19 and 15.20, respectively. The plots are for
1.0 10 14
Regression results by software:
y = 1.4291e + 05 *e (–3963.3x) R= 0.96672 37°C α= C 10 −ΔH °/2.3RT
vh
27°C
40°C
α= C 10 −ΔH °/2.3 RT 20°C
α vh α
30°C
Adsorbate: Rh-B dye 20°C
Adsorbent: Dowex 50 H+ Adsorbate: Staphylococcus aureus
ΔH°/R= 3946 K 10°C Adsorbent: Mendon silt loam
C =142,900 y = 3.5788e+19*e (–3943.8x) R= 0.97341
0.1 vh 13
10
0.00320 0.00325 0.00330 0.00335 0.00340 0.00345 0.00350 0.00355 0.00360 0.0031 0.0032 0.0033 0.0034 0.0035 0.0036 0.0037 0.0038
–1
(a) 1/T (b) 1/T (K )
FIGURE 15.8 Langmuir constant data plotted in terms of van’t Hoff equation, a ¼ C vh e (DH8=RT ) . (a) Dye and resin. (From Hendricks,
D.W. and Kuratti, L.C., Kinetics Part I—A laboratory investigation of six proposed rate laws using batch reactors, Utah Water Research
Laboratory, Utah State University, Report PRWG66-1, p. 20, July 1973.) (b) Bacteria and soil. (From Hendricks, D.W. et al., Water, Air, Soil
Pollut., 12, 226, 1979.)