
Page 670 - Fundamentals of Water Treatment Unit Processes : Physical, Chemical, and Biological
P. 670
Disinfection 625
slightly less so than l 260 nm. Also, the dose would be multiplied by ‘‘2’’; for a 3-log rate, multiplied by ‘‘3,’’
should be high enough such that ‘‘photoreactivation,’’ etc. Of the microorganisms listed, the Adenovirus, a double-
that is, repair in the presence of light, or ‘‘dark repair’’ stranded DNA virus, may be the most resistant to UV inactiva-
repair in the absence of light, is not significant tion (Malley, 2000, p. 9; Malley, 2002a, p. 31). UV inactivation
(Mackey, 2001, pp. 14, 15). of different strains of Cryptosporidium parvum, that is, Iowa,
. For a given reactor, the distribution of contact times Moredun, Glasgow, Maine, TAMU (Texas A&M University)
may be estimated by tracer studies. were compared in a study by Clancy et al. (2002). The study
2
. In general, the order of susceptibility of organisms to showed that 4-log inactivation resulted from 10 mJ=cm for
UV radiation is, the five strains. In a pilot plant, inactivation increased in propor-
tion to detention time (for a given configuration of lamps).
bacteria > viruses > bacterial spores > protozoan cysts: By comparison, for demineralized water, rotavirus, poliovirus,
2
and hepatitis A, inactivation’s were 12, 5, and 2 mJ=cm =log
inactivation, respectively (Box 19.5).
. As a reference for the effect of ‘‘dose,’’ log N=N 0
4 was achieved for Bacillus subtilis spores for a
2
UV dose 31 mJ=cm . 19.3.7.3 Radiation Fundamentals
The starting point for understanding UV inactivation of
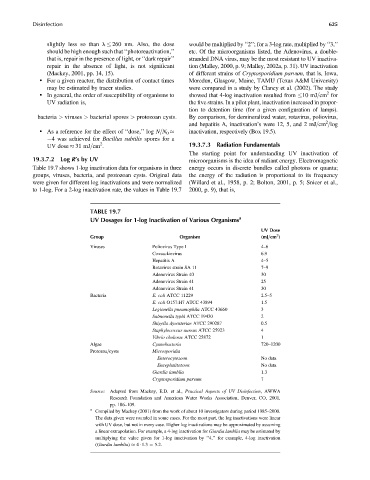
19.3.7.2 Log R’sbyUV microorganisms is the idea of radiant energy. Electromagnetic
Table 19.7 shows 1-log inactivation data for organisms in three energy occurs in discrete bundles called photons or quanta;
groups, viruses, bacteria, and protozoan cysts. Original data the energy of the radiation is proportional to its frequency
were given for different log inactivations and were normalized (Willard et al., 1958, p. 2; Bolton, 2001, p. 5; Snicer et al.,
to 1-log. For a 2-log inactivation rate, the values in Table 19.7 2000, p. 9), that is,
TABLE 19.7
UV Dosages for 1-log Inactivation of Various Organisms a
UV Dose
2
Group Organism (mJ=cm )
Viruses Poliovirus Type I 4–6
Coxsackievirus 6.9
Hepatitis A 4–5
Rotavirus strain SA 11 7–9
Adenovirus Strain 40 30
Adenovirus Strain 41 25
Adenovirus Strain 41 30
Bacteria E. coli ATCC 11229 2.5–5
E. coli O157:H7 ATCC 43894 1.5
Legionella pneumophila ATCC 43660 3
Salmonella typhi ATCC 19430 2
Shigella dysenteriae ATCC 290287 0.5
Staphylococcus aureus ATCC 25923 4
Vibrio cholerae ATCC 25872 1
Algae Cyanobacteria 720–1200
Protozoa=cysts Microsporidia
Enterocytozoon No data
Encephalitozoon No data
Giardia lamblia 1.3
Cryptosporidium parvum 7
Source: Adapted from Mackey, E.D. et al., Practical Aspects of UV Disinfection, AWWA
Research Foundation and American Water Works Association, Denver, CO, 2001,
pp. 106–109.
a
Compiled by Mackey (2001) from the work of about 10 investigators during period 1985–2000.
The data given were rounded in some cases. For the most part, the log inactivations were linear
with UV dose, but not in every case. Higher log inactivations may be approximated by assuming
a linear extrapolation. For example, a 4-log inactivation for Giardia lamblia may be estimated by
multiplying the value given for 1-log inactivation by ‘‘4,’’ for example, 4-log inactivation
(Giardia lamblia) 4 1.3 ¼ 5.2.