
Page 665 - Fundamentals of Water Treatment Unit Processes : Physical, Chemical, and Biological
P. 665
620 Fundamentals of Water Treatment Unit Processes: Physical, Chemical, and Biological
pH
1.0
0 1 2 3 4 5 6 7 8 9 10 11 12 13 14
0 0.9
pH p0H α 2 [OCl]
1 4 mg total chlorine/L 0.8
–5
=5.7 10 mol/L 0.7 α [Cl ]
2
o
2 3 0.6
pC (C in mol/L) 4 5 p[Cl 2 ] α 0.5
0.4
6 0.3
0.2
α 1 [HOCL]
7 0.1
–
p[OCl ] p[HOCL]
8 0.0
0 1 2 3 4 5 6 7 8 9 10 11 12 13 14
(a) (b) pH
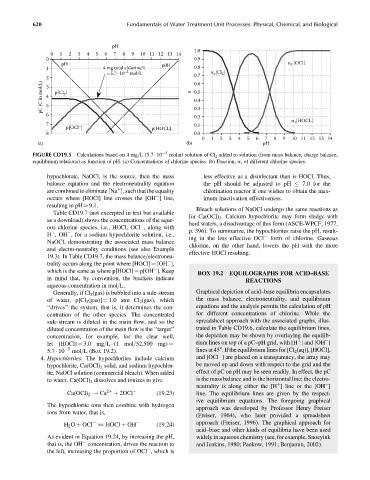
FIGURE CD19.5 Calculations based on 4 mg=L (5.7 10 5 molar) solution of Cl 2 added to solution (from mass balance, charge balance,
equilibrium relations) as function of pH. (a) Concentrations of chlorine species. (b) Fraction, a, of different chlorine species.
hypochlorate, NaOCl, is the source, then the mass less effective as a disinfectant than is HOCl. Thus,
balance equation and the electroneutrality equation the pH should be adjusted to pH 7.0 for the
are combined to eliminate [Na ], such that the equality chlorination reactor if one wishes to obtain the max-
þ
occurs where [HOCl] line crosses the [OH ]line, imum inactivation effectiveness.
resulting in pH 9.1.
Bleach solutions of NaOCl undergo the same reactions as
Table CD19.7 (not excerpted in text but available
for Ca(OCl) 2 . Calcium hypochlorite may form sludge with
as a download) shows the concentrations of the aque-
hard waters, a disadvantage of this form (ASCE-WPCF, 1977,
ous chlorine species, i.e., HOCl, OCl , along with
p. 396). To summarize, the hypochlorites raise the pH, result-
H ,OH , for a sodium hypochlorite solution, i.e.,
þ
ing in the less effective OCl form of chlorine. Gaseous
NaOCl, demonstrating the associated mass balance
chlorine, on the other hand, lowers the pH with the more
and electro-neutrality conditions (see also Example
effective HOCl resulting.
19.3). In Table CD19.7, the mass balance=electroneu-
trality occurs along the point where [HOCl] ¼ [OH ],
which is the same as where p[HOCl]¼ p[OH ]. Keep
BOX 19.2 EQUILOGRAPHS FOR ACID–BASE
in mind that, by convention, the brackets indicate
REACTIONS
aqueous concentration in mol=L.
Generally, if Cl 2 (gas) is bubbled into a side-stream Graphical depiction of acid–base equilibria encapsulates
of water, p[Cl 2 (gas)] ¼ 1.0 atm Cl 2 (gas), which the mass balance, electroneutrality, and equilibrium
‘‘drives’’ the system, that is, it determines the con- equations and the analysis permits the calculation of pH
centration of the other species. The concentrated for different concentrations of chlorine. While the
side-stream is diluted in the main flow, and so the spreadsheet approach with the associated graphs, illus-
diluted concentration of the main flow is the ‘‘target’’ trated in Table CD19.6, calculate the equilibrium lines,
concentration, for example, for the clear well, the depiction may be shown by overlaying the equilib-
rium lines on top of a pC–pH grid, with [H ] and [OH ]
þ
let [HOCl] ¼ 3.0 mg=L (1 mol=52,500 mg) ¼
5.7 10 5 mol=L (Box 19.2). lines at 458. If the equilibrium lines for [Cl 2 (aq)], [HOCl],
4. Hypochlorites: The hypochlorites include calcium and [OCl ] are placed on a transparency, the array may
hypochlorite, Ca(OCl) 2 solid, and sodium hypochlor- be moved up and down with respect to the grid and the
ite, NaOCl solution (commercial bleach). When added effect of pC on pH may be seen readily. In effect, the pC
to water, Ca(OCl) 2 dissolves and ionizes to give is the mass balance and is the horizontal line; the electro-
neutrality is along either the [H ] line or the [OH ]
þ
Ca(OCl) ! Ca 2þ þ 2OCl (19:23) line. The equilibrium lines are given by the respect-
2
ive equilibrium equations. The foregoing graphical
The hypochlorite ions then combine with hydrogen
approach was developed by Professor Henry Freiser
ions from water, that is,
(Freiser, 1964), who later provided a spreadsheet
H 2 O þ OCl , HOCl þ OH (19:24) approach (Freiser, 1996). The graphical approach for
acid–base and other kinds of equilibria have been used
As evident in Equation 19.24, by increasing the pH, widely in aqueous chemistry (see, for example, Snoeyink
that is, the OH concentration, drives the reaction to and Jenkins, 1980; Pankow, 1991; Benjamin, 2002).
the left, increasing the proportion of OCl , which is