Page 661 - Fundamentals of Water Treatment Unit Processes : Physical, Chemical, and Biological
P. 661

616                            Fundamentals of Water Treatment Unit Processes: Physical, Chemical, and Biological


                      TABLE 19.3 (continued)
                      Ct Data for Various Microorganisms and Disinfectants for 2-log (99%) Kill
                                          Conditions                         Disinfectant
                      Microorganism    pH       T (8C)     Chlorine     Chloramine      Ozone      ClO 2
                      E. histolytica   7.0      0–5          400 a
                                                20–29        60 a
                                       8.0      0–5          600 a
                                                20–29        200 a
                      a
                       White (1999, pp. 223, 430) at pH 8.2, HOCL ¼ 80%, OCl ¼ 20%.

                      b
                       Calculated from ratios using data in upper left Ct data cells.
                      c
                       Sobsey (1989, p. 187), Ct(4-log)=2 ¼ Ct(2-log).
                      d
                       Doull, 1980, Table B.1, p. 33; Ct calculated from single concentration and time datum for each organism and each pH
                       condition; all data at T ¼ 58C. Ct calculations corroborated by Ct data from Table II-2 p. 34.
                      e
                       Doull, 1980, Table II-3, p. 40.
                      f
                       Doull, 1980, Table II-5 for ozone, p. 50; compiled from various references.
                      g
                       Doull, 1980, Table II-6 for chlorine dioxide, p. 58.
                      h
                       Wastewater Treatment Plant Design, WPCF Manual of Practice No. 8 (1977, p. 380).
                      i
                       Lev and Regli (1992).
                      j
                       Malcolm Pirnie, Inc., and HDR Engineering, Inc. (1991).
                      k
                       Hibler et al. (1987).
                      l
                       Estimate of order of magnitude.
                      m
                       Li et al. (2001, p. 601).
                      n
                       Langlais (1991, p. 228).
                                                                                        T (°C)
            TABLE CD19.4                                                     0.5          10    15    20    25
                                                                     10            5
            Calculation of Ct’s for Giardia Cysts for Different C,
            pH, T Conditions (Excerpt) a
            C (mg=L)  pH  T (8C)  Ct=log  Ct=2-log  Ct=3-log  Ct=4-log b      log R=3
                                                                    C t (mg/L  min)
            1.00    6.00  0.5    38      76     113     151             log R=2
            1.00    8.00  5.0    59     119     178     238           1
            a                                                            log R=1
             From regression equation of Hibler’s data by Clark et al. (1989, p. 85).
            b             0.176  2.752  0.147
              Ct(4-log) ¼ 0.985C  pH  T  .


                                                                    0.1
              Step 3: Determine the kinetic coefficient in Chick’s law,
              Equation 19.6, based upon the time determined for 99%     0.0037    0.0036     0.0035    0.0034
              kill, that is, C=C 0 ¼ 0.01, at C ¼ 2.5 mg=L.                  0.00365    0.00355   0.00345   0.00335
                                                                                           –1
                                                                                       1/T (K )
                   N
                 ln  ¼ k(2:5mg=L monochloramine)   t(99% kill)
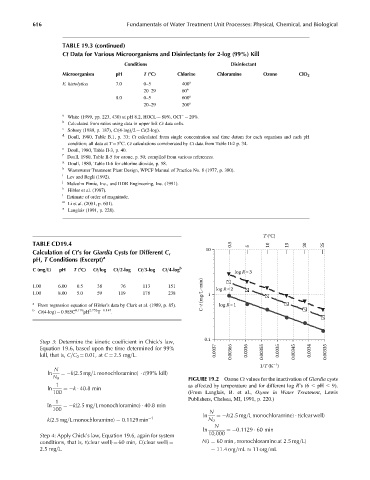
                  N 0                                          FIGURE 19.2  Ozone Ct values for the inactivation of Giardia cysts
                   1                                           as affected by temperature and for different log R’s(6   pH   9).
                 ln   ¼ k   40:8 min
                  100                                          (From Langlais, B. et al., Ozone in Water Treatment, Lewis
                                                               Publishers, Chelsea, MI, 1991, p. 220.)
                   1
                 ln   ¼ k(2:5mg=L monochloramine)   40:8 min
                  100                                                 N
                                                                    ln  ¼ k(2:5mg=L monochloramine)   t(clear well)
                 k(2:5mg=L monochloramine) ¼ 0:1129 min  1            N 0
                                                                        N
                                                                    ln      ¼ 0:1129   60 min
              Step 4: Apply Chick’s law, Equation 19.6, again for system  10,000
                                                                    N(t ¼ 60 min , monochloramine at 2:5mg=L)
              conditions, that is, t(clear well) ¼ 60 min, C(clear well) ¼
              2.5 mg=L.                                               ¼ 11:4 org=mL   11 org=mL
   656   657   658   659   660   661   662   663   664   665   666