
Page 664 - Fundamentals of Water Treatment Unit Processes : Physical, Chemical, and Biological
P. 664
Disinfection 619
TABLE 19.5
Reactions and Equilibrium Statements for Chlorine Gas Dissolution
Reaction Equilibrium Statement
1. Equilibrium between gas and aqueous Cl 2
Cl 2 (aq)
Cl 2 (g) ! Cl 2 (aq) K H ¼ ¼ 7283 mg=L=atm (19.18)
Cl 2 (g)
2. Aqueous chlorine reaction with water
[HOCl][H ][Cl ]
þ
Cl 2 (aq) þ H 2 O ! HOCl þ H þ Cl K 1 ¼ ¼ 10 3:3 (19.19)
þ
[Cl 2 (aq)]
3. Hypochlorous acid dissociation
[H ][OCl ]
þ
HOCl ! H þ OCl K x2 ¼ ¼ 10 7:5 (19.20)
þ
[HOCl]
4. HCl dissociation
[H ][Cl ]
þ
HCl ! H þ Cl K x3 ¼ ¼ 10 þ3 (19.21)
þ
[HCl]
5. Water dissociation
H 2 O ! H þ OH K w ¼ [H ][OH ] ¼ 10 14 (19.22)
þ
þ
K H from Table H.5; full units are mg dissolved chlorine=L aqueous solution=atm Cl 2 gas.
K 1 and K 2 were obtained from Pankow (1991, pp. 435, 442); for comparison, White (1999, p. 217) gives pK 2 (208C) ¼ 7.7.
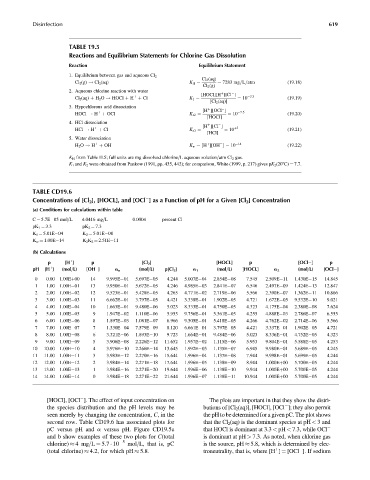
TABLE CD19.6
Concentrations of [Cl 2 ], [HOCL], and [OCl ] as a Function of pH for a Given [Cl 2 ] Concentration
(a) Conditions for calculations within table
C ¼ 5.7E 05 mol=L 4.0416 mg=L 0.0004 percent Cl
pK 1 ¼ 3.3 pK 2 ¼ 7.3
K 1 ¼ 5.01E 04 K 2 ¼ 5.01E 08
K w ¼ 1.00E 14 K 2 K 2 ¼ 2.51E 11
(b) Calculations
p [H ] p [Cl 2 ] [HOCL] p [OCl ] p
þ
pH [H ] (mol=L) [OH ] a o (mol=L) p[Cl 2 ] a 1 (mol=L) [HOCL] a 2 (mol=L) [OCl ]
þ
0 0.00 1.00Eþ00 14 9.995E 01 5.697E 05 4.244 5.007E 04 2.854E 08 7.545 2.509E 11 1.430E 15 14.845
1 1.00 1.00E 01 13 9.950E 01 5.672E 05 4.246 4.985E 03 2.841E 07 6.546 2.497E 09 1.424E 13 12.847
2 2.00 1.00E 02 12 9.523E 01 5.428E 05 4.265 4.771E 02 2.719E 06 5.566 2.390E 07 1.362E 11 10.866
3 3.00 1.00E 03 11 6.662E 01 3.797E 05 4.421 3.338E 01 1.902E 05 4.721 1.672E 05 9.532E 10 9.021
4 4.00 1.00E 04 10 1.663E 01 9.480E 06 5.023 8.333E 01 4.750E 05 4.323 4.175E 04 2.380E 08 7.624
5 5.00 1.00E 05 9 1.947E 02 1.110E 06 5.955 9.756E 01 5.561E 05 4.255 4.888E 03 2.786E 07 6.555
6 6.00 1.00E 06 8 1.897E 03 1.081E 07 6.966 9.505E 01 5.418E 05 4.266 4.762E 02 2.714E 06 5.566
7 7.00 1.00E 07 7 1.330E 04 7.579E 09 8.120 6.661E 01 3.797E 05 4.421 3.337E 01 1.902E 05 4.721
8 8.00 1.00E 08 6 3.321E 06 1.893E 10 9.723 1.664E 01 9.484E 06 5.023 8.336E 01 4.752E 05 4.323
9 9.00 1.00E 09 5 3.906E 08 2.226E 12 11.652 1.957E 02 1.115E 06 5.953 9.804E 01 5.588E 05 4.253
10 10.00 1.00E 10 4 3.976E 10 2.266E 14 13.645 1.992E 03 1.135E 07 6.945 9.980E 01 5.689E 05 4.245
11 11.00 1.00E 11 3 3.983E 12 2.270E 16 15.644 1.996E 04 1.137E 08 7.944 9.998E 01 5.699E 05 4.244
12 12.00 1.00E 12 2 3.984E 14 2.271E 18 17.644 1.996E 05 1.138E 09 8.944 1.000Eþ00 5.700E 05 4.244
13 13.00 1.00E 13 1 3.984E 16 2.271E 20 19.644 1.996E 06 1.138E 10 9.944 1.000Eþ00 5.700E 05 4.244
14 14.00 1.00E 14 0 3.984E 18 2.271E 22 21.644 1.996E 07 1.138E 11 10.944 1.000Eþ00 5.700E 05 4.244
[HOCl], [OCl ]. The effect of input concentration on The plots are important in that they show the distri-
the species distribution and the pH levels may be butions of [Cl 2 (aq)], [HOCl], [OCl ]; they also permit
seen merely by changing the concentration, C, in the the pH to be determined for a given pC. The plot shows
second row. Table CD19.6 has associated plots for that the Cl 2 (aq) is the dominant species at pH < 3and
pC versus pH and a versus pH. Figure CD19.5a that HOCl is dominant at 3.3 < pH < 7.3, while OCl
and b show examples of these two plots for C(total is dominant at pH > 7.3. As noted, when chlorine gas
5
chlorine) 4mg=L ¼ 5.7 10 mol=L, that is, pC is the source, pH 5.8, which is determined by elec-
(total chlorine) 4.2, for which pH 5.8. troneutrality, that is, where [H ] ¼ [OCl ]. If sodium
þ