
Page 693 - Fundamentals of Water Treatment Unit Processes : Physical, Chemical, and Biological
P. 693
648 Fundamentals of Water Treatment Unit Processes: Physical, Chemical, and Biological
dielectric, with space (gap) between, charged by an alternating T (°C)
current source; electrons flow across the gap in proportion to 39.35 29.88 25.36 20.97 16.71 12.56 8.54 4.63 0.83
the voltage difference. The dielectric is commonly glass or 1000
ceramic material. Air or oxygen is passed between the plates Phenol
and through the corona discharge; the oxygen reacts to Mesitylene
become ozone, O 3 . The electrodes may be in the shape of
two plates in parallel, or two concentric cylinders. The process
•
is not efficient, since only about 0.15 fraction of the energy is k (L/mol s) 100
used for the O 2 to O 3 conversion; therefore about 0.85 fraction 1,1,2-trichloroethylene
is heat and must be removed. The ozone production rate is a 10
function of the peak voltage, frequency, and the geometry of Toluene
Benzene
the cell. Typical voltages are 10,000–19,000 V and most
generators are in the medium frequency range of 60–1000 Hz.
1
For every 100 kg=h of gas flowing, 1–10 kg=h ozone is pro-
duced, depending on applied voltage, whether the gas is air 0.003250 0.003300 0.003350 0.003400 0.003450 0.003500 0.003550 0.003600 0.003650
or oxygen, flow of feed gas, and cooling water temperature
1/T (K)
(Rakeness et al., 1996, p. 4).
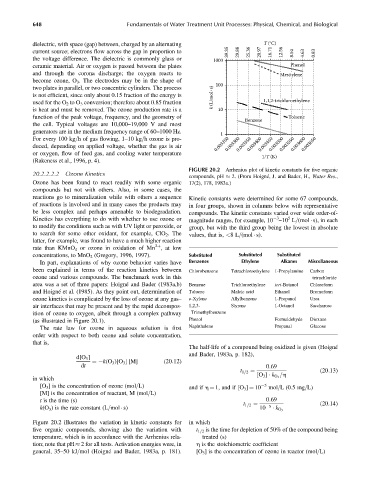
FIGURE 20.2 Arrhenius plot of kinetic constants for five organic
20.2.2.2.2 Ozone Kinetics
compounds, pH 2. (From Hoigné, J. and Bader, H., Water Res.,
Ozone has been found to react readily with some organic 17(2), 178, 1983a.)
compounds but not with others. Also, in some cases, the
reactions go to mineralization while with others a sequence Kinetic constants were determined for some 67 compounds,
of reactions is involved and in many cases the products may in four groups, shown in columns below with representative
be less complex and perhaps amenable to biodegradation. compounds. The kinetic constants varied over wide order-of-
5
3
Kinetics has everything to do with whether to use ozone or magnitude ranges, for example, 10 –10 L=(mol s), in each
to modify the conditions such as with UV light or peroxide, or group, but with the third group being the lowest in absolute
to search for some other oxidant, for example, ClO 2 . The values, that is, <8L=(mol s).
latter, for example, was found to have a much higher reaction
rate than KMnO 4 or ozone in oxidation of Mn , at low
2þ
concentrations, to MnO 2 (Gregory, 1996, 1997). Substituted Substituted Substituted
In part, explanations of why ozone behavior varies have Benzenes Ethylene Alkanes Miscellaneous
been explained in terms of the reaction kinetics between Chlorobenzene Tetrachloroethylene 1-Propylamine Carbon
ozone and various compounds. The benchmark work in this tetrachloride
area was a set of three papers: Hoigné and Bader (1983a,b) Benzene Trichloroethylene tert-Butanol Chloroform
and Hoigné et al. (1985). As they point out, determination of Toluene Maleic acid Ethanol Bromoform
ozone kinetics is complicated by the loss of ozone at any gas– o-Xylene Allylbenzene 1-Propanol Urea
air interfaces that may be present and by the rapid decompos- 1,2,3- Styrene 1-Octanol Saccharose
ition of ozone to oxygen, albeit through a complex pathway Trimethylbenzene
(as illustrated in Figure 20.1). Phenol Formaldehyde Dioxane
The rate law for ozone in aqueous solution is first Naphthalene Propanal Glucose
order with respect to both ozone and solute concentration,
that is,
The half-life of a compound being oxidized is given (Hoigné
and Bader, 1983a, p. 182),
d[O 3 ]
¼ k(O 3 )[O 3 ] [M] (20:12)
dt 0:69
(20:13)
t 1=2 ¼
=h
in which
[O 3 ] k O 3
[O 3 ] is the concentration of ozone (mol=L) and if h ¼ 1, and if [O 3 ] ¼ 10 5 mol=L (0.5 mg=L)
[M] is the concentration of reactant, M (mol=L)
t is the time (s) 0:69 (20:14)
k(O 3 ) is the rate constant (L=mol s) t 1=2 ¼ 10 5 k O 3
Figure 20.2 illustrates the variation in kinetic constants for in which
five organic compounds, showing also the variation with t 1=2 is the time for depletion of 50% of the compound being
temperature, which is in accordance with the Arrhenius rela- treated (s)
tion; note that pH 2 for all tests. Activation energies were, in h is the stoichiometric coefficient
general, 35–50 kJ=mol (Hoigné and Bader, 1983a, p. 181). [O 3 ] is the concentration of ozone in reactor (mol=L)