
Page 82 - Fundamentals of Water Treatment Unit Processes : Physical, Chemical, and Biological
P. 82
Water Contaminants 37
national legislation that would enforce nationwide drinking
water standards. Consequently, pursuant to the 1973 SDWA, Seawater
THM, one of the implicated species of chlorinated hydrocar-
bons, was regulated in 1978 with a MCL set at 100 mg=L.
Subsequent research implicated the whole family of chlorin- Groundwaters
ated hydrocarbons as being possibly carcinogenic, and also a
variety of other organic compounds. Thus, in 1986, when
Surface waters Swamps
the SDWA was reauthorized, the number of regulated con-
taminants in drinking water was expanded from 25 from
the 1962 USPHS-recommended drinking water standards Biological treatment effluents
(Anon, 1962), to 83, with the requirement stipulated in the
law that 25 new contaminants be added to the list every Wastewaters
3 years. The expanded list included natural organics, syn-
0.1 1 10 100 1000
thetic organics, and volatile organics. The change from TOC (mg/L)
recommended federal standards to mandated ones constituted
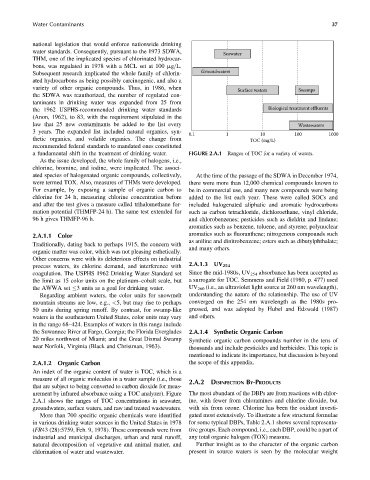
a fundamental shift in the treatment of drinking water. FIGURE 2.A.1 Ranges of TOC for a variety of waters.
As the issue developed, the whole family of halogens, i.e.,
chlorine, bromine, and iodine, were implicated. The associ-
ated species of halogenated organic compounds, collectively, At the time of the passage of the SDWA in December 1974,
were termed TOX. Also, measures of THMs were developed. there were more than 12,000 chemical compounds known to
For example, by exposing a sample of organic carbon to be in commercial use, and many new compounds were being
chlorine for 24 h, measuring chlorine concentration before added to the list each year. These were called SOCs and
and after the test gives a measure called trihalomethane for- included halogenated aliphatic and aromatic hydrocarbons
mation potential (THMFP-24 h). The same test extended for such as carbon tetrachloride, dichloroethane, vinyl chloride,
96 h gives THMFP-96 h. and chlorobenzenes; pesticides such as dieldrin and lindane;
aromatics such as benzene, toluene, and styrene; polynuclear
2.A.1.1 Color aromatics such as fluoranthene; nitrogenous compounds such
as aniline and dinitrobenzene; esters such as dibutylphthalate;
Traditionally, dating back to perhaps 1915, the concern with
and many others.
organic matter was color, which was not pleasing esthetically.
Other concerns were with its deleterious effects on industrial
2.A.1.3
process waters, its chlorine demand, and interference with UV 254
coagulation. The USPHS 1962 Drinking Water Standard set Since the mid-1980s, UV 254 absorbance has been accepted as
the limit as 15 color units on the platinum–cobalt scale, but a surrogate for TOC. Semmens and Field (1980, p. 477) used
the AWWA set 3 units as a goal for drinking water. UV 260 (i.e., an ultraviolet light source at 260 nm wavelength),
Regarding ambient waters, the color units for snowmelt understanding the nature of the relationship. The use of UV
mountain streams are low, e.g., <5, but may rise to perhaps converged on the 254 nm wavelength as the 1980s pro-
50 units during spring runoff. By contrast, for swamp-like gressed, and was adopted by Hubel and Edzwald (1987)
waters in the southeastern United States, color units may vary and others.
in the range 68–424. Examples of waters in this range include
the Suwannee River at Fargo, Georgia; the Florida Everglades 2.A.1.4 Synthetic Organic Carbon
20 miles northwest of Miami; and the Great Dismal Swamp Synthetic organic carbon compounds number in the tens of
near Norfolk, Virginia (Black and Christman, 1963). thousands and include pesticides and herbicides. This topic is
mentioned to indicate its importance, but discussion is beyond
2.A.1.2 Organic Carbon the scope of this appendix.
An index of the organic content of water is TOC, which is a
measure of all organic molecules in a water sample (i.e., those
2.A.2 DISINFECTION BY-PRODUCTS
that are subject to being converted to carbon dioxide for meas-
urement by infrared absorbance using a TOC analyzer). Figure The most abundant of the DBPs are from reactions with chlor-
2.A.1 shows the ranges of TOC concentrations in seawater, ine, with fewer from chloramines and chlorine dioxide, but
groundwaters, surface waters, and raw and treated wastewaters. with six from ozone. Chlorine has been the oxidant investi-
More than 700 specific organic chemicals were identified gated most extensively. To illustrate a few structural formulae
in various drinking water sources in the United States in 1978 for some typical DBPs, Table 2.A.1 shows several representa-
(FR43 (28):5759, Feb. 9, 1978). These compounds were from tive groups. Each compound, i.e., each DBP, could be a part of
industrial and municipal discharges, urban and rural runoff, any total organic halogen (TOX) measure.
natural decomposition of vegetative and animal matter, and Further insight as to the character of the organic carbon
chlorination of water and wastewater. present in source waters is seen by the molecular weight