
Page 175 - Gas Purification 5E
P. 175
162 Gas Piw$cation
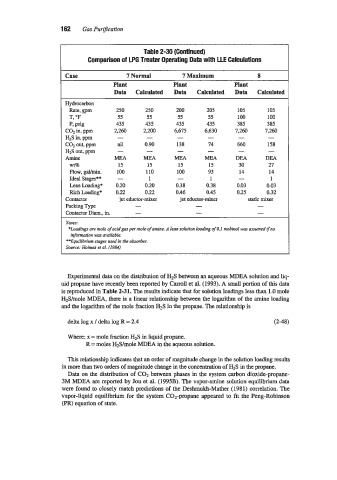
Table 2-30 (Continued)
Comparison of LPG Treater Operating Data with LLE Calculations
Case 7 Normal 7 Maximum 8
Plant Plant Plant
Data Calculated Data Calculated Data Calculated
Hydrocarbon
Rate, gpm 250 250 200 205 105 105
55 55 55 55 100 100
T, OF
P, psig 435 435 435 435 385 385
COz in, ppm 2,260 2,200 6,675 6,630 7,260 7,260
HIS in, ppm - - - - - -
C02 out, ppm nil 0.90 138 74 660 158
HIS out. ppm - - - - - -
Amine MEA MEA MEA MEA DEA DEA
wt% 15 15 15 15 30 27
Flow, gallmin. 100 110 100 93 14 14
Ideal Stages** - 1 - 1 - 1
Lean Loading* 0.20 0.20 0.38 0.38 0.03 0.03
Rich Loading* 0.22 0.22 0.46 0.45 0.25 0.32
Contactor jet eductor-mixer jet eductor-mixer static mixer
Packing Type - - -
Contactor Dim., in. - - -
Xores:
*Loadings are mole of acid- per mole of amine. A lean solution loading of 0.1 mohwl M.W assumed if no
infornmioii was available.
**Equilibrium stages used in the absorber.
Source: Holmes et al. 11984)
Experimental data on the distribution of H2S between an aqueous h4DEA solution and liq-
uid propane have recently been reported by Carroll et al. (1993). A small portion of this data
is reproduced in Table 2-31. The results indicate that for solution loadings less than 1.0 mole
H2S/mole MDEA, there is a linear relationship between the logarithm of the amine loading
and the logarithm of the mole fraction H2S in the propane. The relationship is
delta log x / delta log R = 2.4 (2-48)
Where: x = mole fraction H2S in liquid propane.
R = moles H2S/mole h4DEA in the aqueous solution.
This relationship indicates that an order of magnitude change in the solution loading results
in more than two orders of magnitude change in the concentration of HIS in the propane.
Data on the distribution of C02 between phases in the system carbon dioxidepropane-
3M MDEA are reported by Jou et al. (1995B). The vapor-amine solution equilibrium data
were found to closely match predictions of the Deshmukh-Mather (1981) correlation. The
vapor-liquid equilibrium for the system C02-propane appeared to fit the Peng-Robinson
(PR) equation of state.