
Page 38 - Gas Purification 5E
P. 38
28 Gas purification
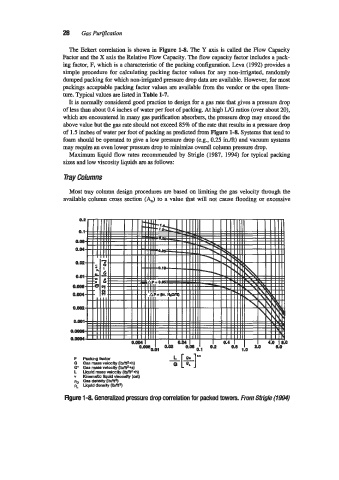
The Ekert correlation is shown in Figure 1-8. The Y axis is called the Flow Capacity
Factor and the X axis the Relative Flow Capacity. The flow capacity factor includes a pack-
ing factor, F, which is a characteristic of the packing configuration. Leva (1992) provides a
simple procedure for calculating packing factor values for any non-imgated, randomly
dumped packing for which non-inigated pressure drop data are available. However, for most
packings acceptable packing factor values are available from the vendor or the open litera-
ture. Typical values are listed in Table 1-7.
It is normally considered good practice to design for a gas rate that gives a pressure drop
of less than about 0.4 inches of water per foot of packing. At high UG ratios (over about 20),
which are encountered in many gas purification absorbers, the pressure drop may exceed the
above value but the gas rate should not exceed 85% of the rate that results in a pressure drop
of 1.5 inches of water per foot of packing as predid from Figure 1-8. Systems that tend to
foam should be operated to give a low pressure drop (e.g., 0.25 in./ft) and vacuum systems
may require an even lower pressure drop to minimize overall column pressure drop.
Maximum liquid flow rates recommended by Strigle (1987, 1994) for typical packing
sizes and low viscosity liquids are as follows:
Tny Columns
Most tray column design procedures are based on limiting the gas velocity through the
available column cross section (AJ to a value that will not cause flooding or excessive
+[%-I"
F Packingfactor
G Gas~~rsYelOCi(lbAtZ.h)
G* Gas mass velocHy (lblff2.s)
L Liquld mass velocHy (iWt2 oh)
v Kinematic llquid visccslty (cst)
po --Sitymm
4 Uquiddensity(Ib/@)
Figure 1-8. Generalized pressure drop correlation for packed towers. From Wg/e (1994)