
Page 35 - Gas Purification 5E
P. 35
Introduction 25
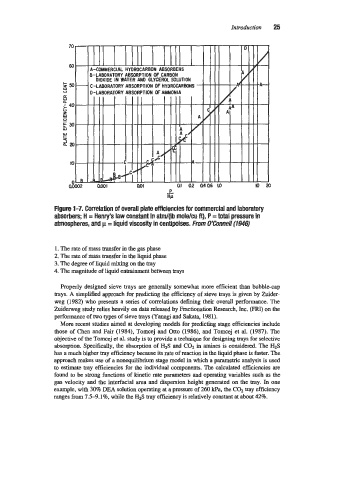
Figure 1-7. Correlation of overall plate efficiencies for commercial and laboratory
absorbers; H = Henry’s law constant in atm/(lb mole/cu ft)’ P = total pressure in
atmospheres, and p = liquid viscosity in centipoises. From O%onne// (194s)
1. The rate of mass transfer in the gas phase
2. The rate of mass transfer in the liquid phase
3. The degree of liquid mixing on the tray
4. The magnitude of liquid entrainment between trays
Properly designed sieve trays are generally somewhat more efficient than bubble-cap
trays. A simplified approach for predicting the efficiency of sieve trays is given by Zuider-
weg (1982) who presents a series of correlations defining their overall performance. The
Zuiderweg study relies heavily on data released by Fractionation Research, Inc. (€XI) on the
performance of two types of sieve trays (Yanagi and Sakata, 1981).
More recent studies aimed at developing models for predicting stage efficiencies include
those of Chen and Fair (1984), Tomcej and Otto (1986), and Tomcej et al. (1987). The
objective of the Tomcej et al. study is to provide a technique for designing trays for selective
absorption. Specifically, the absorption of H2S and C02 in amines is considered. The H2S
has a much higher tray efficiency because its rate of reaction in the liquid phase is faster. The
approach makes use of a nonequilibnum stage model in which a parametric analysis is used
to estimate tray efficiencies for the individual components. The calculated efficiencies are
found to be strong functions of kinetic rate parameters and operating variables such as the
gas velocity and the interfacial area and dispersion height generated on the tray. In one
example, with 30% DEA solution operating at a pressure of 260 kPa, the C02 tray efficiency
ranges from 7.5-9.1%, while the H2S tray efficiency is relatively constant at about 42%.