
Page 140 - Gas Wettability of Reservoir Rock Surfaces with Porous Media
P. 140
124 Gas Wettability of Reservoir Rock Surfaces with Porous Media
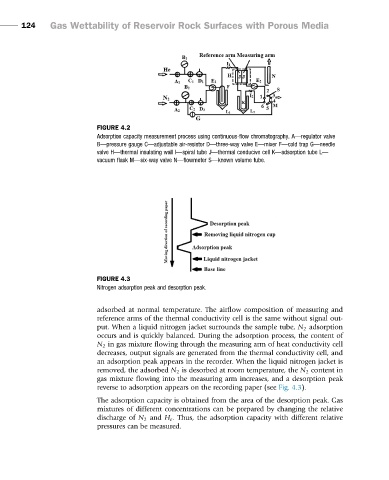
FIGURE 4.2
Adsorption capacity measurement process using continuous-flow chromatography. A—regulator valve
B—pressure gauge C—adjustable air-resistor D—three-way valve E—mixer F—cold trap G—needle
valve H—thermal insulating wall I—spiral tube J—thermal conducive cell K—adsorption tube L—
vacuum flask M—six-way valve N—flowmeter S—known volume tube.
FIGURE 4.3
Nitrogen adsorption peak and desorption peak.
adsorbed at normal temperature. The airflow composition of measuring and
reference arms of the thermal conductivity cell is the same without signal out-
put. When a liquid nitrogen jacket surrounds the sample tube, N 2 adsorption
occurs and is quickly balanced. During the adsorption process, the content of
N 2 in gas mixture flowing through the measuring arm of heat conductivity cell
decreases, output signals are generated from the thermal conductivity cell, and
an adsorption peak appears in the recorder. When the liquid nitrogen jacket is
removed, the adsorbed N 2 is desorbed at room temperature, the N 2 content in
gas mixture flowing into the measuring arm increases, and a desorption peak
reverse to adsorption appears on the recording paper (see Fig. 4.3).
The adsorption capacity is obtained from the area of the desorption peak. Gas
mixtures of different concentrations can be prepared by changing the relative
discharge of N 2 and H e . Thus, the adsorption capacity with different relative
pressures can be measured.