
Page 51 - Gas Wettability of Reservoir Rock Surfaces with Porous Media
P. 51
Evaluation Methods and Influencing Factors CHAPTER 2 35
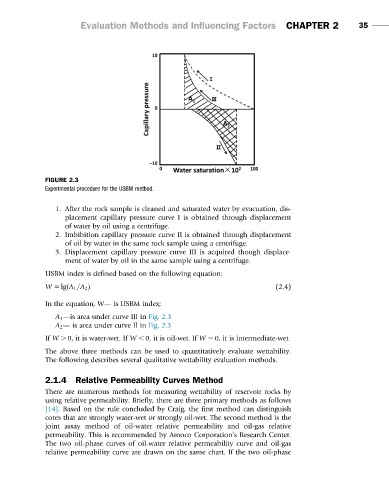
FIGURE 2.3
Experimental procedure for the USBM method.
1. After the rock sample is cleaned and saturated water by evacuation, dis-
placement capillary pressure curve I is obtained through displacement
of water by oil using a centrifuge.
2. Imbibition capillary pressure curve II is obtained through displacement
of oil by water in the same rock sample using a centrifuge.
3. Displacement capillary pressure curve III is acquired though displace-
ment of water by oil in the same sample using a centrifuge.
USBM index is defined based on the following equation:
W 5 lgðA 1 =A 2 Þ (2.4)
In the equation, W— is USBM index;
A 1 —is area under curve III in Fig. 2.3
A 2 — is area under curve II in Fig. 2.3
If W . 0, it is water-wet. If W , 0, it is oil-wet. If W 5 0, it is intermediate-wet.
The above three methods can be used to quantitatively evaluate wettability.
The following describes several qualitative wettability evaluation methods.
2.1.4 Relative Permeability Curves Method
There are numerous methods for measuring wettability of reservoir rocks by
using relative permeability. Briefly, there are three primary methods as follows
[14]. Based on the rule concluded by Craig, the first method can distinguish
cores that are strongly water-wet or strongly oil-wet. The second method is the
joint assay method of oil-water relative permeability and oil-gas relative
permeability. This is recommended by Amoco Corporation’s Research Center.
The two oil-phase curves of oil-water relative permeability curve and oil-gas
relative permeability curve are drawn on the same chart. If the two oil-phase