
Page 229 - Gas Adsorption Equilibria
P. 229
4. Volumetric – Gravimetric Measurements 215
In Figure 4.16 coadsorption equilibria data of the above mentioned
gas mixture on AC D47/3 at T = 293 K for pressures up to 1.4 MPa are
shown. Absolute masses of and of adsorbed per unit mass
are presented as function of the sorptive gas pressure.
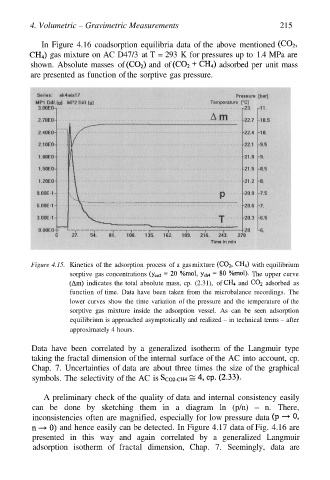
Figure 4.15. Kinetics of the adsorption process of a gas mixture with equilibrium
sorptive gas concentrations The upper curve
indicates the total absolute mass, cp. (2.31), of and adsorbed as
function of time. Data have been taken from the microbalance recordings. The
lower curves show the time variation of the pressure and the temperature of the
sorptive gas mixture inside the adsorption vessel. As can be seen adsorption
equilibrium is approached asymptotically and realized – in technical terms – after
approximately 4 hours.
Data have been correlated by a generalized isotherm of the Langmuir type
taking the fractal dimension of the internal surface of the AC into account, cp.
Chap. 7. Uncertainties of data are about three times the size of the graphical
symbols. The selectivity of the AC is
A preliminary check of the quality of data and internal consistency easily
can be done by sketching them in a diagram ln (p/n) – n. There,
inconsistencies often are magnified, especially for low pressure data
and hence easily can be detected. In Figure 4.17 data of Fig. 4.16 are
presented in this way and again correlated by a generalized Langmuir
adsorption isotherm of fractal dimension, Chap. 7. Seemingly, data are