
Page 230 - Gas Adsorption Equilibria
P. 230
216 Chapter 4
consistent. However, it should be noticed that linear interpolation of high
pressure data to intersections with the ln (p/n) axis would lead to numerical
values of Henry-coefficients of the coadsorbate which are different from the
values indicated by the correlation curves in Fig. 4.17.
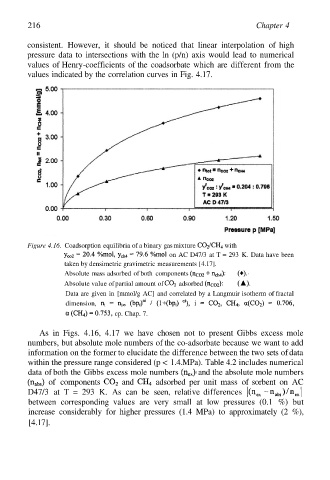
Figure 4.16. Coadsorption equilibria of a binary gas mixture with
on AC D47/3 at T = 293 K. Data have been
taken by densimetric gravimetric measurements [4.17].
Absolute mass adsorbed of both components
Absolute value of partial amount of adsorbed
Data are given in [mmol/g AC] and correlated by a Langmuir isotherm of fractal
dimension,
cp. Chap. 7.
As in Figs. 4.16, 4.17 we have chosen not to present Gibbs excess mole
numbers, but absolute mole numbers of the co-adsorbate because we want to add
information on the former to elucidate the difference between the two sets of data
within the pressure range considered (p < 1.4.MPa). Table 4.2 includes numerical
data of both the Gibbs excess mole numbers and the absolute mole numbers
of components and adsorbed per unit mass of sorbent on AC
D47/3 at T = 293 K. As can be seen, relative differences
between corresponding values are very small at low pressures (0.1 %) but
increase considerably for higher pressures (1.4 MPa) to approximately (2 %),
[4.17].